Scotland going ages without polling, even as major events lead to dozens of UK-level polls sloshing about the place, then suddenly getting multiple polls all at once? Groundbreaking. Meryl Streep impressions aside, this is one of three polls that all dropped in a 24 hour period. Although this was the last to publish, I believe it was the first to complete fieldwork, and certainly the first to publish tables, and thus it gets first shot at a full analysis piece.
This is the second poll of this term so far from Survation (link to tables), the first having been the one Ballot Box Scotland commissioned earlier this year. This one has instead come from Scotland in Union, a more obviously partisan commissioning organisation than most other polls. It’s long-standing BBS policy (since 2019) not to cover some aspects of SiU commissioned polls, particularly relating to Independence. Since they rarely feature Holyrood voting intention, that hasn’t been a particular issue, as only Holyrood-inclusive polls get these analysis pieces anyway. As this poll does include Holyrood, I am covering the parliamentary components of it for completion’s sake.
The previous Survation covered the 24th to 28th of March. Changes are shown as (vs that poll / vs last election). For comparison, since these three all came out at once, see the ComRes and the YouGov analysis pieces.
Regional Vote
A lot of really dramatic stuff in this! Firstly, that SNP figure is their joint worst of the term. There’s a real split in pollsters on this, with Survation joining ComRes in giving low shares. Whilst I lean towards the view this is exaggeratedly low, it still gives the SNP reason to be concerned. I wrote before May’s local elections that I reckoned the list vote, for all its imperfections, was probably closest to the “natural” spread of votes in Scotland, and was vindicated by how the SNP’s local vote largely mirrored their list poll average at the time.
Regardless, that puts Labour within touching distance on this vote, with a share they haven’t seen since the month of the Independence referendum in 2014. They have almost twice as many votes as the Conservatives, whose vote has collapsed to a level not seen since February 2016.
Even worse for the Conservatives, that means they’re in a statistical tie with the Greens. In the tables, a handful more people said Green than Conservative, hence the ordering in the chart above. Not only is this a joint all-time high for the Greens, it’s also only the third time they’ve either tied (March 2007) or beaten (February 2015) the Conservatives in a poll. The caution here is that high Green shares are also particularly common with Survation and ComRes, as a counterbalance to their low SNP findings.
Finally, the Lib Dems don’t have any particularly exciting notes – this is close to, but not quite, their best figure of the term. Of course, given their decade of stagnation, they’d be more than happy with this. Survation also continue to ask about a wider range of smaller parties, and find that Alba remain so invisible in Scottish political discourse that they fall behind the equally invisible Reform UK.
Constituency Vote
The constituency ballot is almost always less dramatic, and that’s the case here. The SNP are down but not very much compared to both the last poll and 2021, that would be key to maintaining their inflated share of FPTP seats. Labour nonetheless demonstrate substantial growth, with a vote share they haven’t seen since January 2015. For the Conservatives, the last time they did this badly for this vote was February 2016. Finally, this is an oddly poor share figure for the Lib Dems, down a point compared to both the election and last poll, given their much better performance for the list vote.
Seat Projection
Projecting that into seats might give us something like this:
Please see this page for how projections work and important caveats.
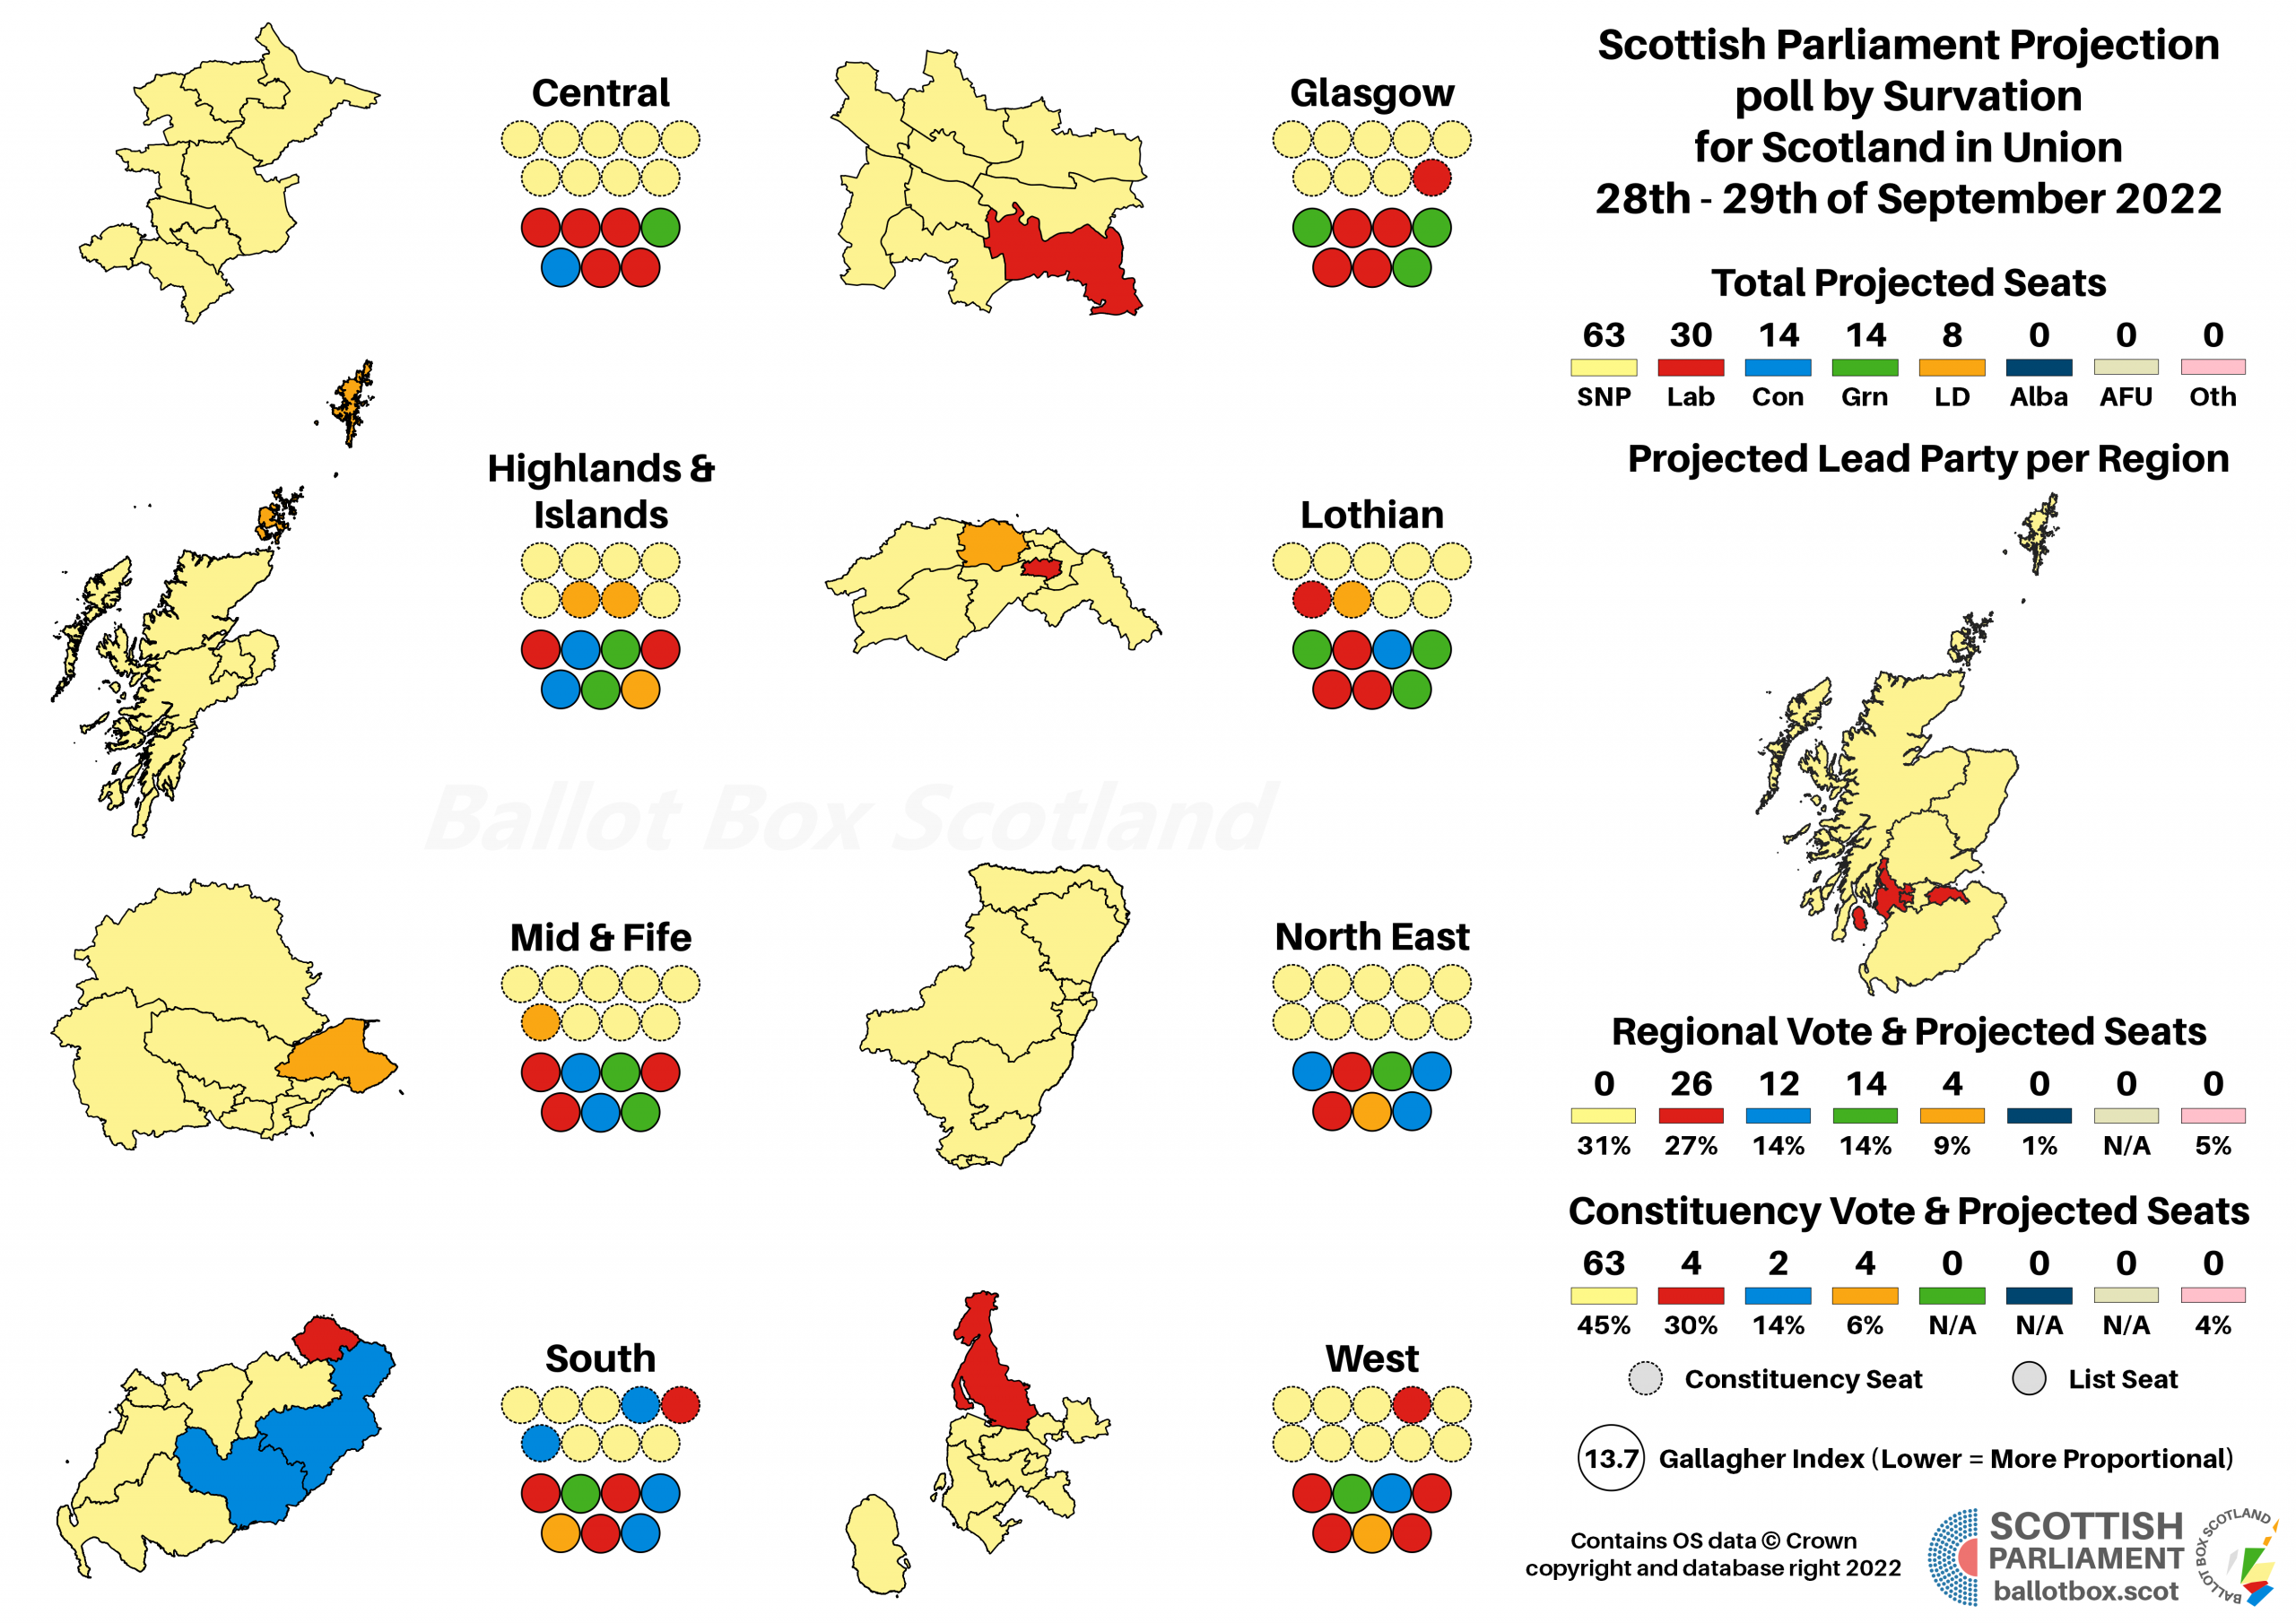
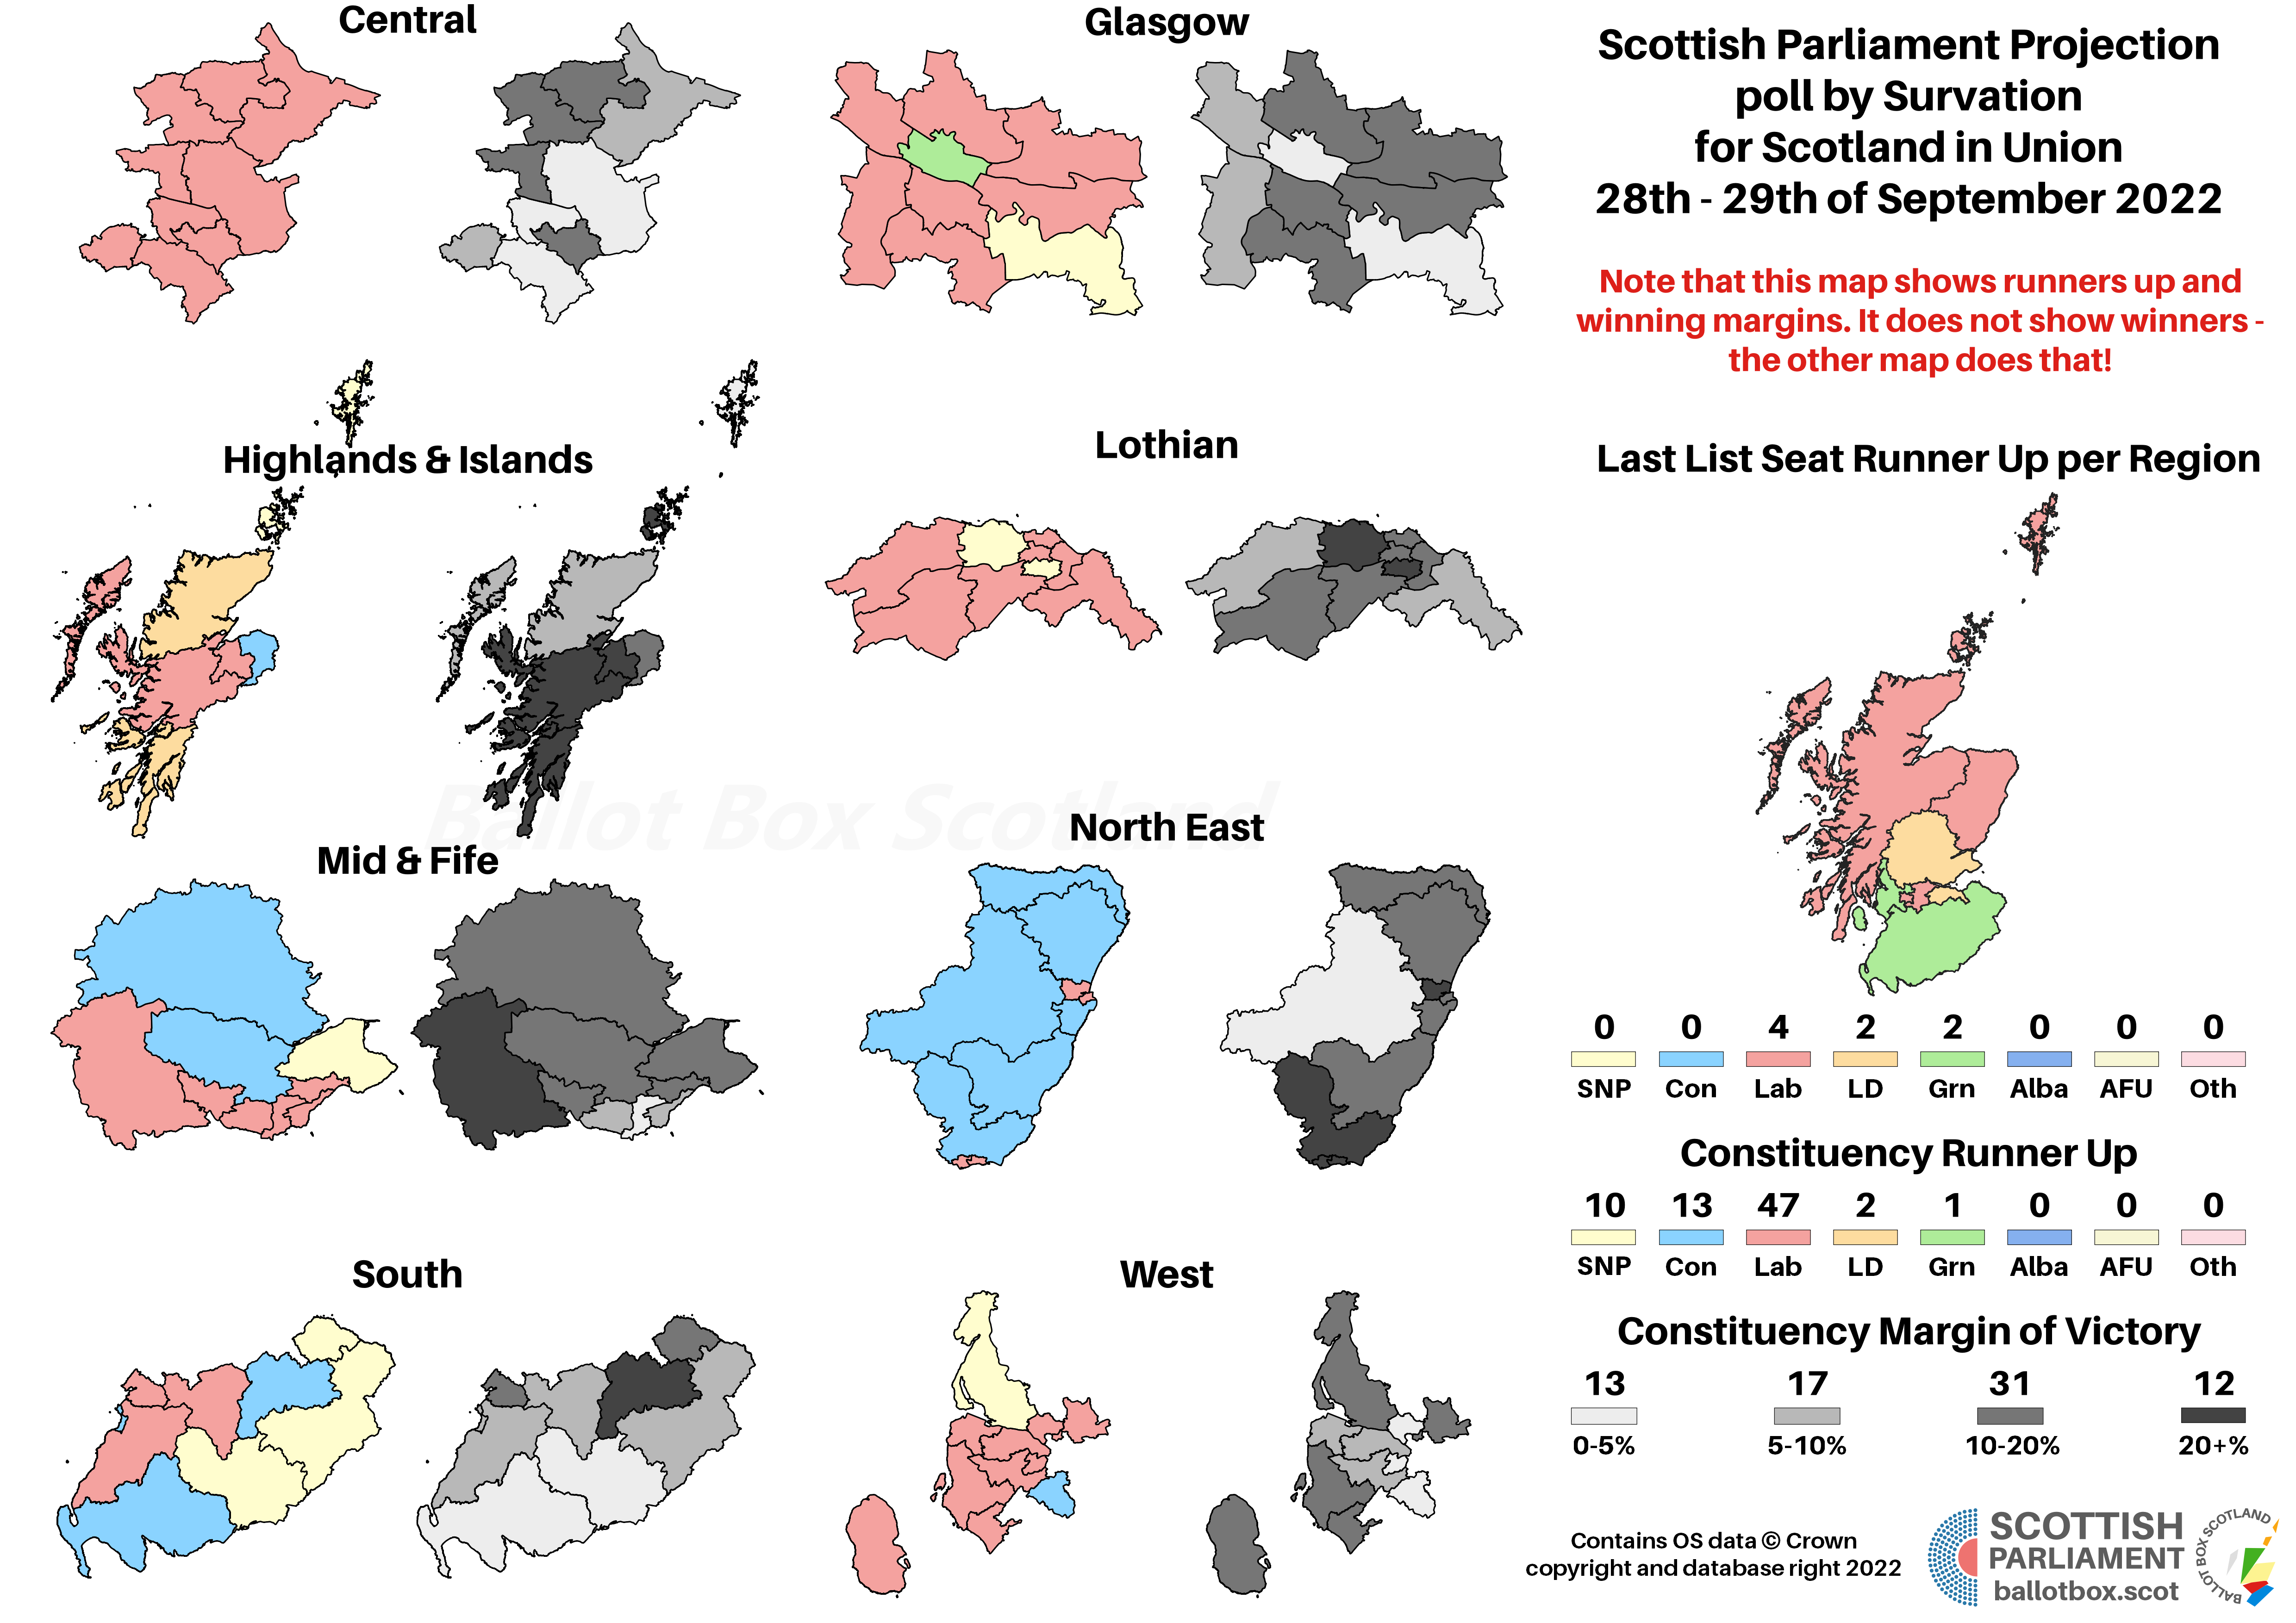
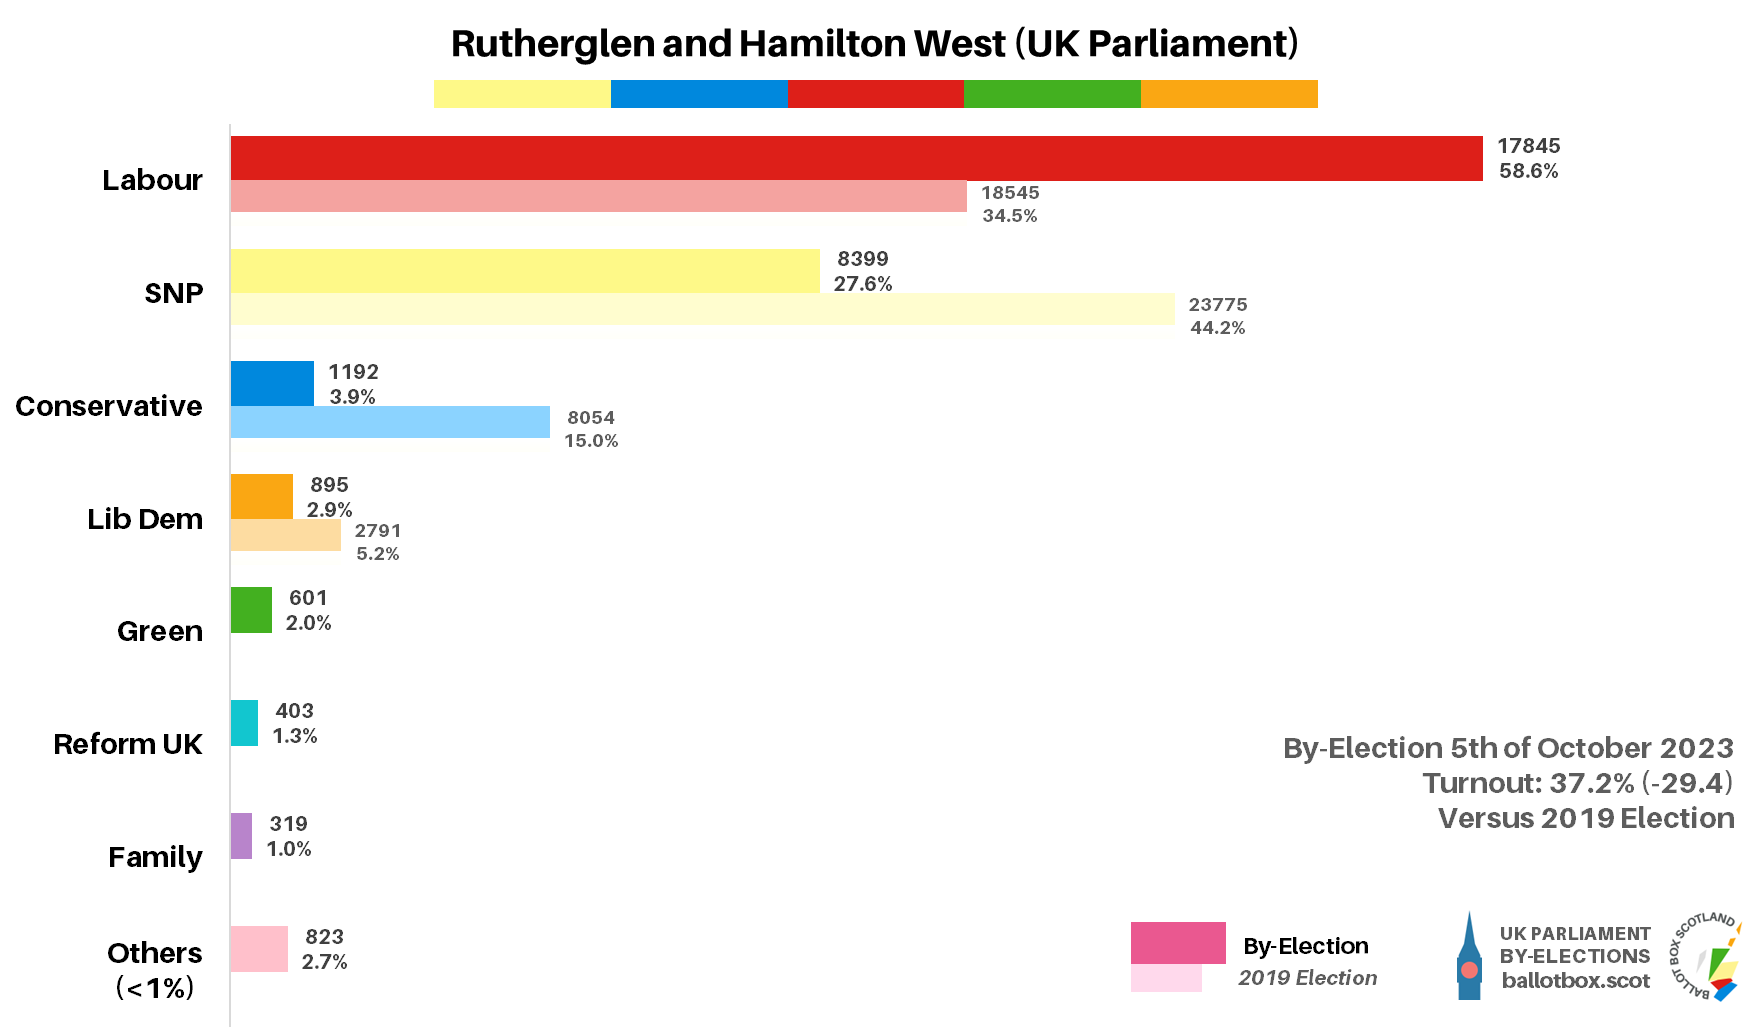
Caveats about projections, especially for FPTP, firmly in mind, this poll is notable for being the first of the term to show Labour regaining any constituency seats lost in 2016, as they are estimated to pick up Rutherglen. The SNP nonetheless make a net gain in constituencies by nibbling away at the Conservatives, who are level with the Greens in seats. Notably shocking results for the Conservatives include being wiped out in Glasgow, electing only a single Lothian MSP, and even falling behind Labour in Highlands and Islands.
Note too that Labour project to winning the most regional votes in Glasgow, Lothian and West. I have to admit I’m so used to those being pure yellow I forgot to even check before publishing the initial Twitter coverage, and only realised afterwards the closeness of the list vote would have flipped some regions! All that drama aside, AMS is AMS, and this would be a comfortable re-election for the SNP-Green cooperative government.
This is what we needed it to answer some questions arising from UK-level polling. Firstly – yes, this is an extremely weak result for the Conservatives, matching their worst-ever vote share at the 2015 election. Secondly, that’s definitely played heavily in Labour’s favour, with a big jump up to a share that also hasn’t been seen since January 2015. Thirdly though, look at that SNP share – up very slightly from 2019.
That is still a massive challenge for Scottish Labour. Although it’d be a 4% improvement from their 2017 vote share, when they won 7 seats, the SNP are 7% better off than their performance at that election. A couple of Labour’s wins in 2017, for example Glasgow North East, were even closer than 3%, and so may remain out of their grasp so long as the SNP remain roughly on a part with their 2019 result.
Where they could make comebacks are the places where the SNP lead is already small, which are very limited, and/or the seats with a large enough Conservative vote to cannibalise. That would include the two seats with MPs who joined Alba, and both of the seats Hamilton splits between. However! Remember that boundary changes are due ahead of the next election. Depending on how those shake out, that could further complicate the question of where Labour can make gains. Regardless, if this was what happened at an election, I struggle to see how Labour get out of single-digit seats.
Turning back to the Conservatives, these sort of figures are often taken as suggesting a 1997-style wipeout. That is certainly a possibility, but I’d expect at least the primary Borders seat to still be tinted blue. It’s never been a strong area for Labour, and the Conservatives have dug themselves in quite strongly. That said, they wouldn’t exactly relish the thought of returning to the wilderness days of a single Scottish MP.
As noted above, and explained in the linked editorial policy page, I do not cover Scotland in Union’s non-standard Independence polling. That’s not the only oddity in the poll – there’s an entire page in the published charts on the reasons why Independence to Union switchers did so. Given that’s an unweighted subsample of 86 folk, weighting to 65, I’m surprised that those questions were published.
I know some on the Pro-Union side get cross with these kinds of remarks, but I’m going to be frank: Scotland in Union, as they have every right to do, like to pitch their polling so it gives them nice findings, that favour their constitutional position, so they can get media coverage. They are a campaign organisation with a publicly stated and obvious partisan position, that’s par for the course, and I’m not criticising them. From a campaigning perspective they are getting their approach spot on. It just means the output is nigh on unusable from the perspective of a non-partisan polling aggregator.
Hypotheticals
As ever, the last little bit of analysis concerns those hypothetical and more proportional voting systems that I have a bee in my bonnet about here at BBS. The fact Westminster uses pure FPTP is an affront to democracy, and though Holyrood fares far better, AMS is still deeply imperfect. The examples here simply transpose the poll findings onto more proportional voting systems – the reality is that different systems would of course result in different voter behaviour.
For the moment, although the maps are useful for illustrative purposes, I’m opting just to show these hypotheticals as charts. It’s very time consuming making maps, and for these pure hypotheticals, it’s possibly a bit overkill.
You can reform AMS to strengthen the proportional element, but you can’t truly restore proportionality so long as FPTP is involved and the SNP are dominant in that vote. As with the real system, this version still gives a very comfortable SNP-Green majority.
But if you move to a fully proportional system, you get something much more reflective of the public vote. Almost a third of what would be SNP constituency seats under AMS would, in this model, cascade down to substantially bolster every other party’s representation. It would also follow the constitutional breakdown of voters, with pro-Union MSPs outnumbering their pro-Independence counterparts by 68 to 61.
Scandinavian Style Westminster
I always come to the Westminster bit of this segment and feel it looks less dramatic, but that’s only because I don’t do pure-FPTP projections and thus don’t have non-PR seat numbers in my head. In reality, this would be a much smaller SNP group, give Labour a genuine recovery, and even allow the Conservatives to stave off the dreaded nul point – I mean, seats.
If you find this or other Ballot Box Scotland output useful and/or interesting, and you can afford to do so, please consider donating to support my work. I love doing this, but it’s a one-man project and takes a lot of time and effort. All donations, no matter how small, are greatly appreciated and extremely helpful.
(About Donations)