After nearly a year’s absence, YouGov have finally re-emerged with an absolute peach of a Scottish poll. It contains all three parliaments plus the first proper Independence VI since December, making it almost worth the wait. Overlapping with but finishing just after the Panelbase poll that I posted about yesterday, this continues the trend of Scottish pollsters being unable to resist making me do huge amounts of work in a short space of time.
Compared to the last time there were overlapping polls, these two are somewhat more closely aligned despite their differences. Further, these are the first Scottish polls since The Independent Group became Change UK, and since the Brexit Party siphoned off most of UKIPs MEPs and support. This is quite the bumper post, so hope you’re comfy!
Display format;
- Party – Vote% (Change vs last poll by agency / Change vs last election or referendum)
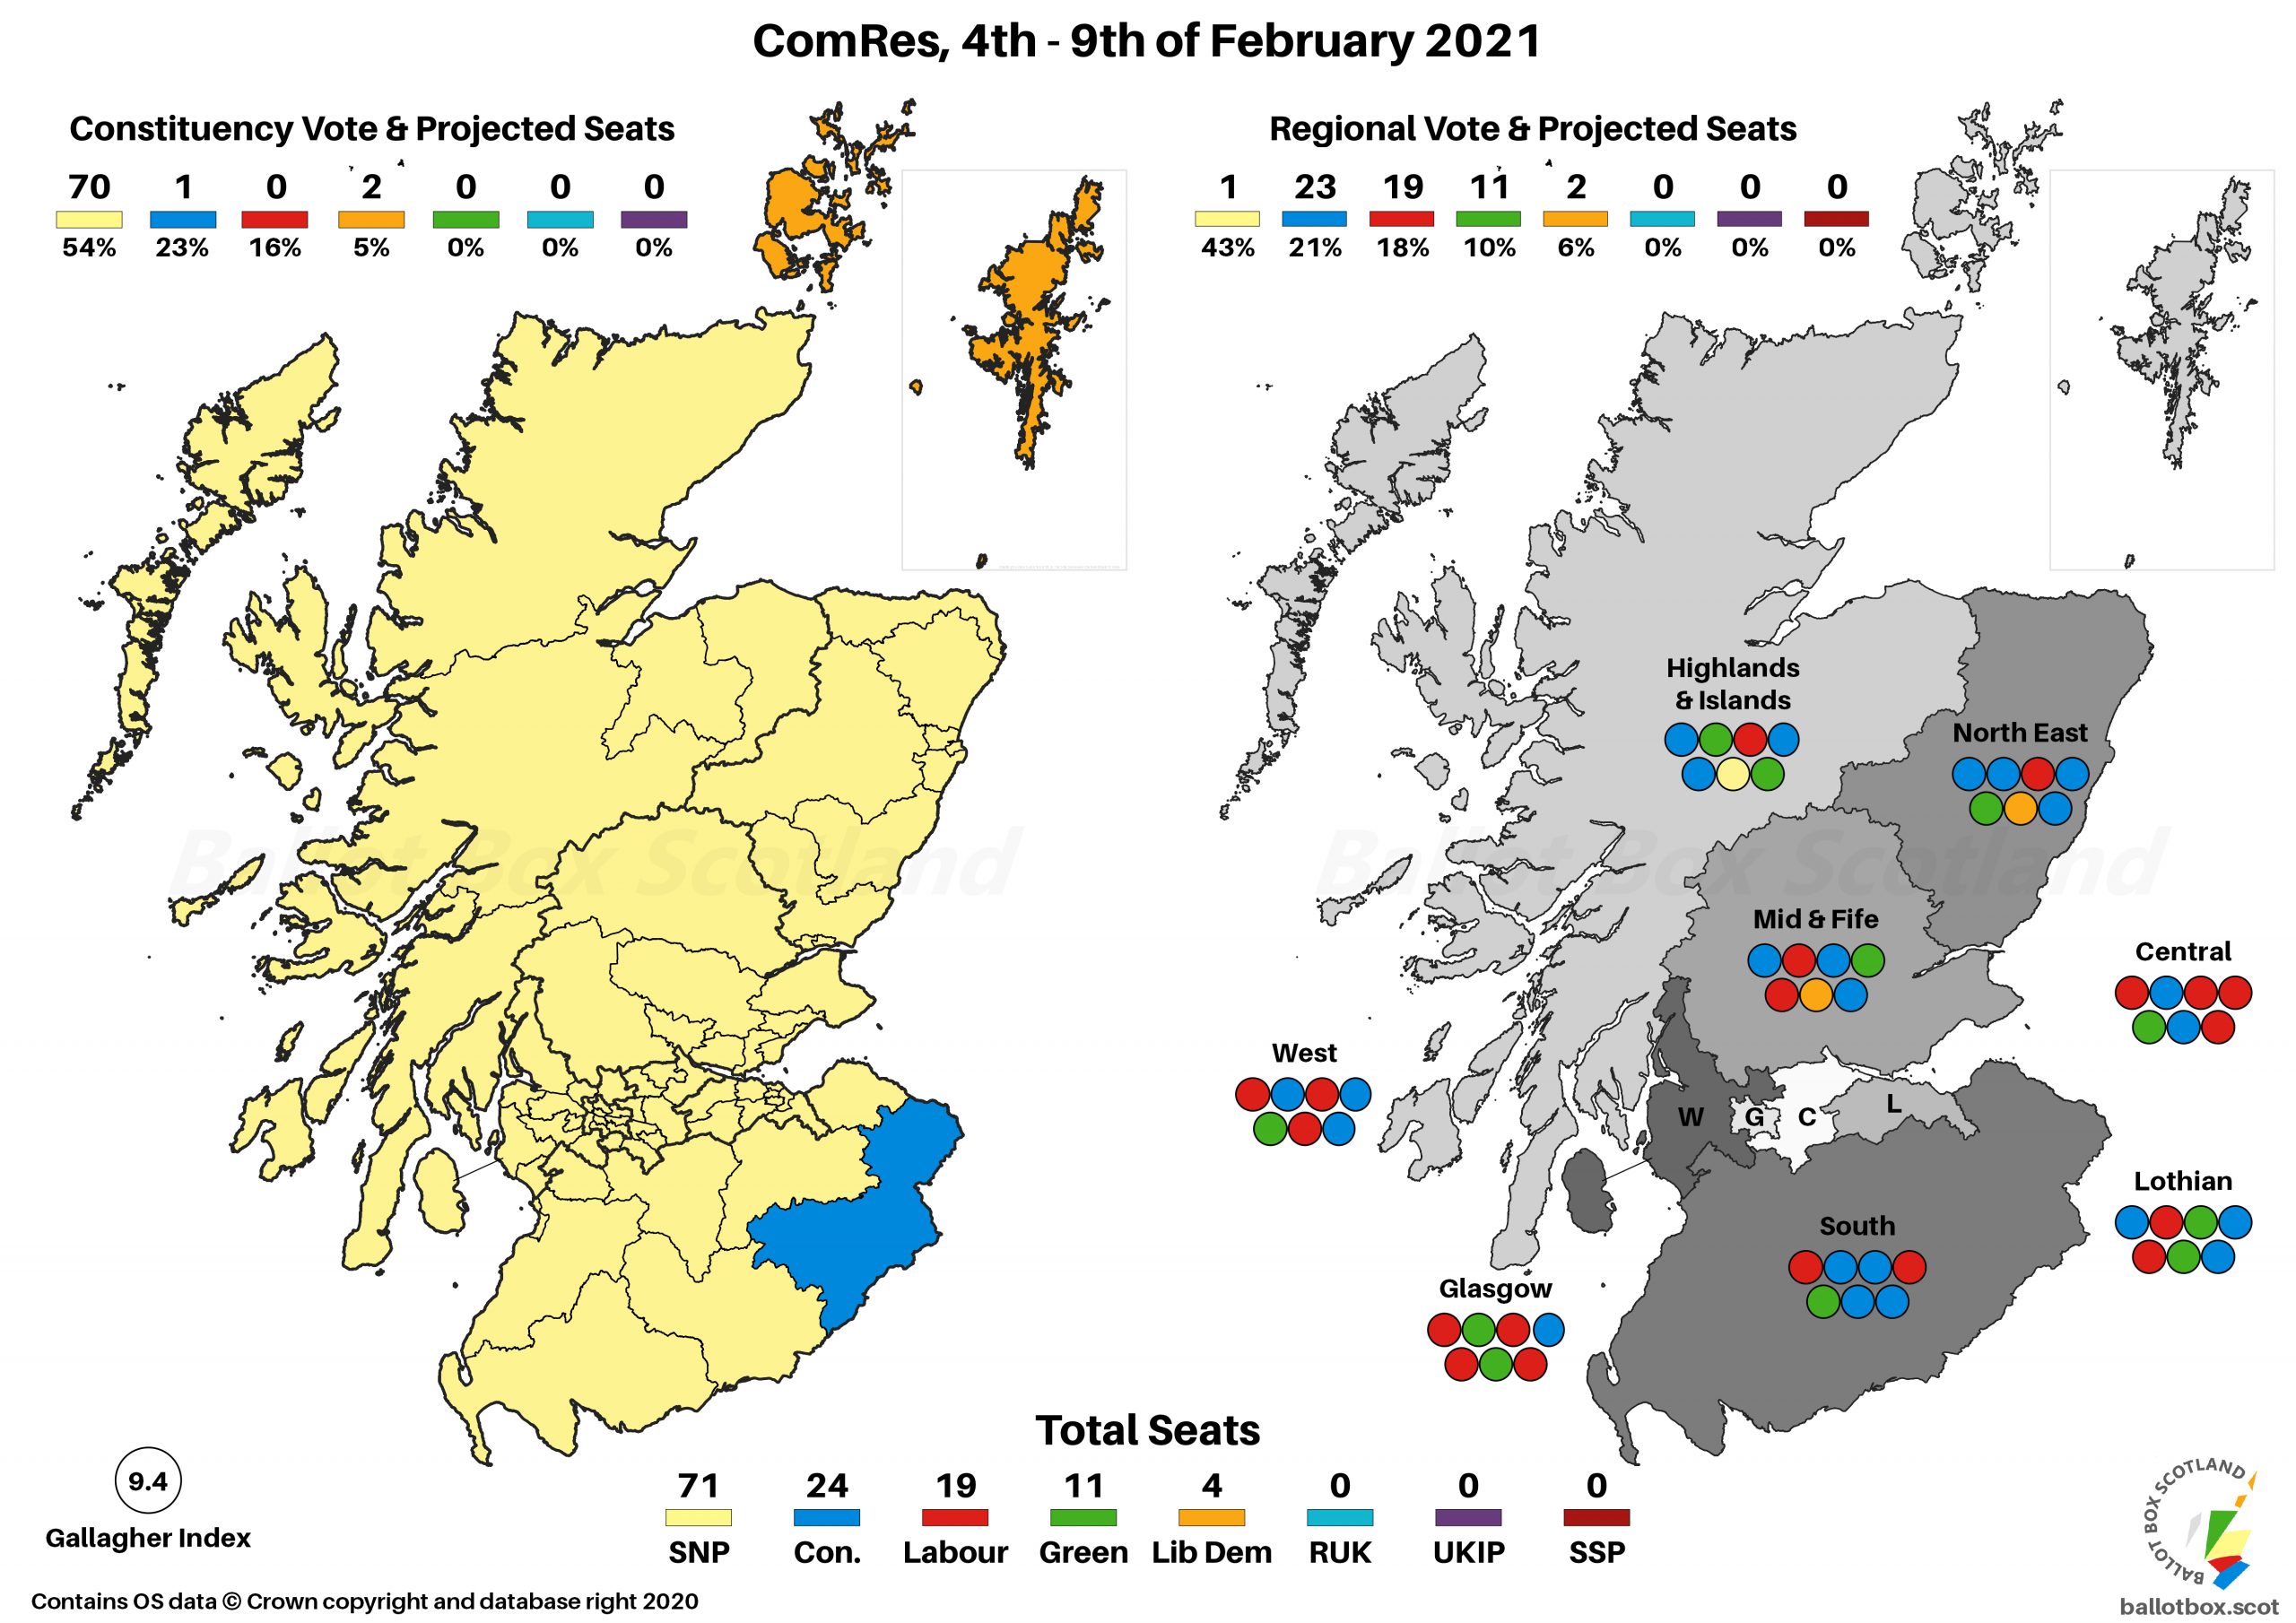
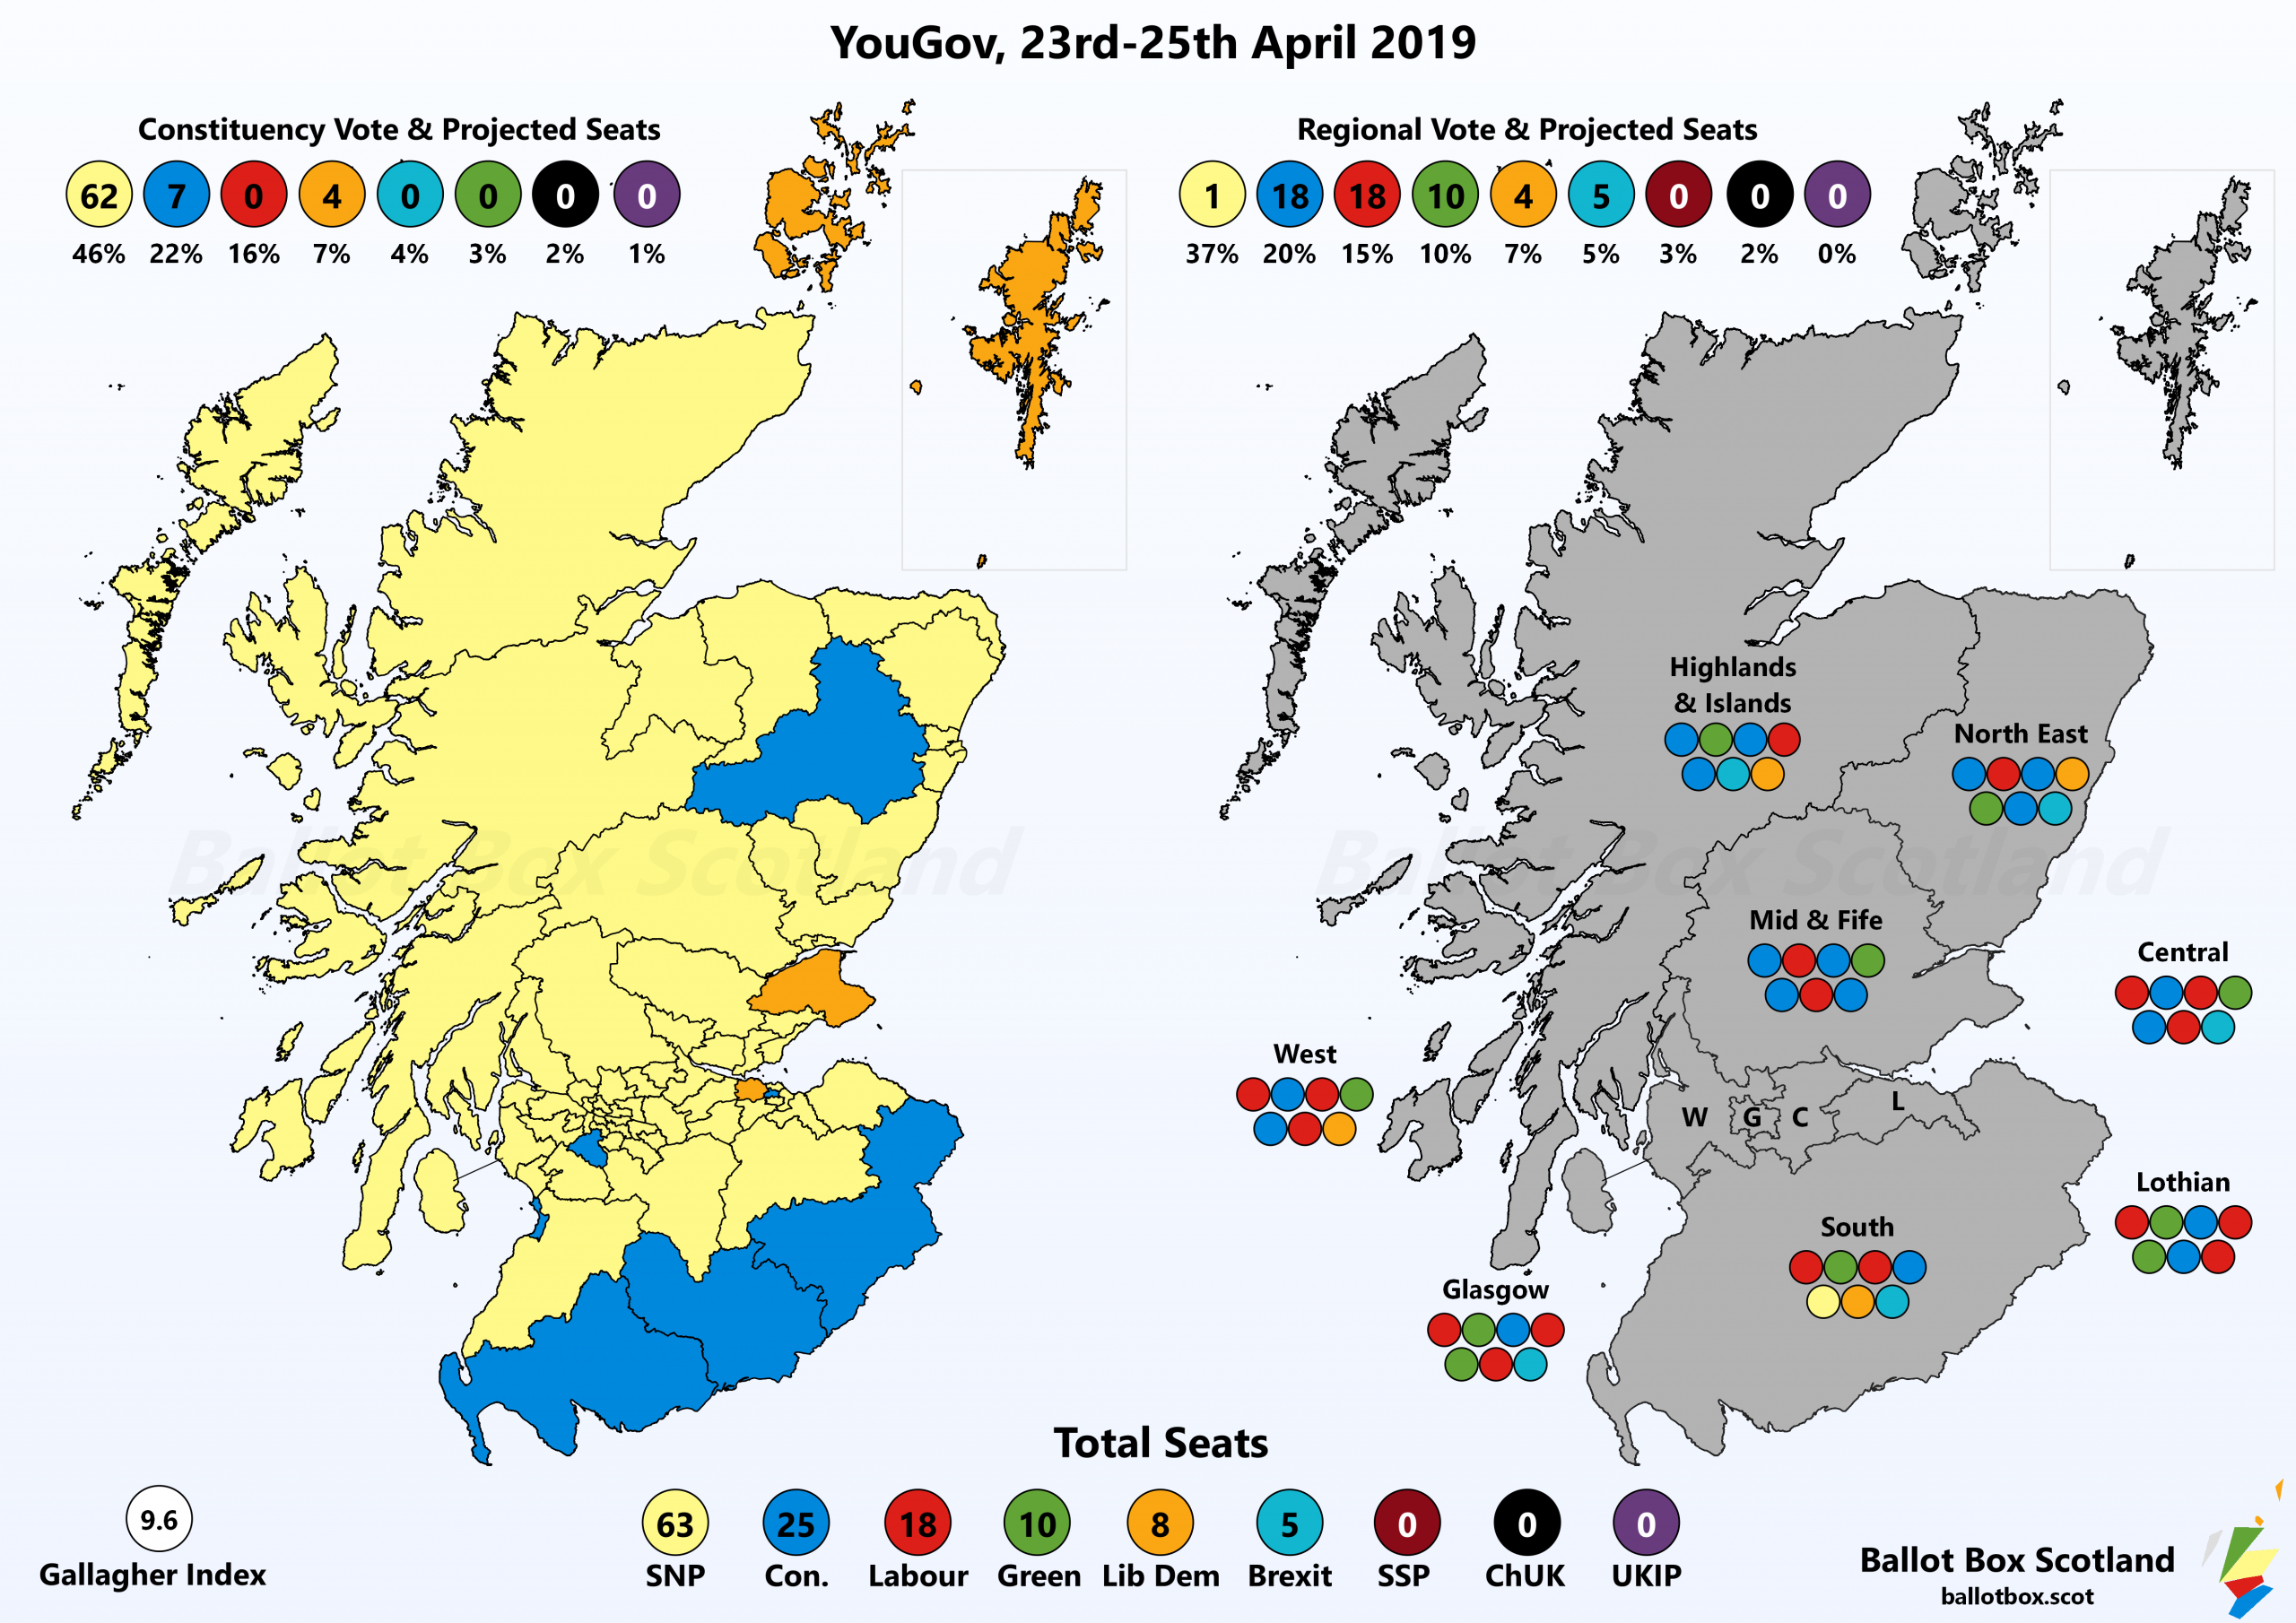
Holyrood Voting Intention and Projection (Tracker)
Regional;
- SNP – 37% (+5 / -5)
- Conservative – 20% (-6 / -3)
- Labour – 15% (-6 / -4)
- Green – 10% (+1 / +3)
- Lib Dem – 7% (nc / +2)
- Brexit – 5% (+5 / +5)
- SSP – 3% (nc / +2)
- Change UK – 2% (+2 / +2)
- UKIP – 2% (+1 / nc)
Constituency;
- SNP – 46% (+5 / -1)
- Conservative – 22% (-5 / nc)
- Labour – 16% (-6 / -7)
- Lib Dem – 7% (+1 / -1)
- Brexit – 4% (+4 / +4)
- Green – 3% (+1 / +2)
- Change UK – 1% (+1 / +1)
A lot to digest here. For the SNP, this brings YouGov in line with Panelbase list polling which shows relatively high scores, and the constituency figure is their highest anywhere since the snap 2017 election. Labour on the other hand are only just above the historic lows they were on before that election boosted them somewhat. The Conservatives too were found to be on some of their lowest figures in that time.
For the smaller parties, YouGov continues its “high Greens, low Lib Dems” trend, as well as the remarkable but distinctly outlier-y SSP figure. Of the two new parties, the Brexit Party have equalled the absolute best of UKIPs polling since 2016 whilst ChUK barely register. When compared with the overlapping Panelbase poll, this one is more favourable to the SNP and the smaller parties and less to the Conservatives and Labour.
If we project that into seats it might look like;
- SNP – 63 (+9 / nc)
- Conservative – 25 (-8 / -6)
- Labour – 18 (-8 / -6)
- Green – 10 (+1 / +4)
- Lib Dem – 8 (+1 / +3)
- Brexit – 5 (+5 / +5)

This projection suggests Holyrood’s pro-Independence majority would grow from 69 to 73 seats. Against a recent trend towards pro-Union majorities, this completes a hat trick where the most recent poll from Survation, Panelbase and YouGov all project the other way. Apart from that, what’s perhaps most remarkable is the complete lack of Labour red on the constituency map. The usual caveats about projecting national polling figures to constituencies applies, but with the SNP down only marginally on last time and Labour down a lot, this anticipates that they’d lose their last 3 constituencies. The Conservatives would drop as many seats as Labour, but retain all of their constituencies.
The Greens and Lib Dems would have a comfortable bit of growth on these figures, with Greens breaking into double digits again. The distinguishes YouGov from Panelbase but aligns it with Survation. Most notably, the Brexit Party come out with 5 seats for their 5%. Eagle-eyed folk looking at the tables on the polling tracker pages might notice that UKIP twice recorded 5%, but have literally only been projected with one seat in one poll the entire time since 2016. So why are Brexit doing better on the same vote share?
It’s partly our old friend overhang, and partly comparatively healthy Labour shares previously. With Labour’s list vote dropping so sharply, it creates the space for Brexit MSPs to be elected. I’d urge caution in expecting too many Brexit MSPs, if any, to be elected in 2021 as this may be a contextual reaction to the current Brexit impasse. Remember UKIP did well pre-2016 before amounting to nothing. Nonetheless it’s still quite impressive.
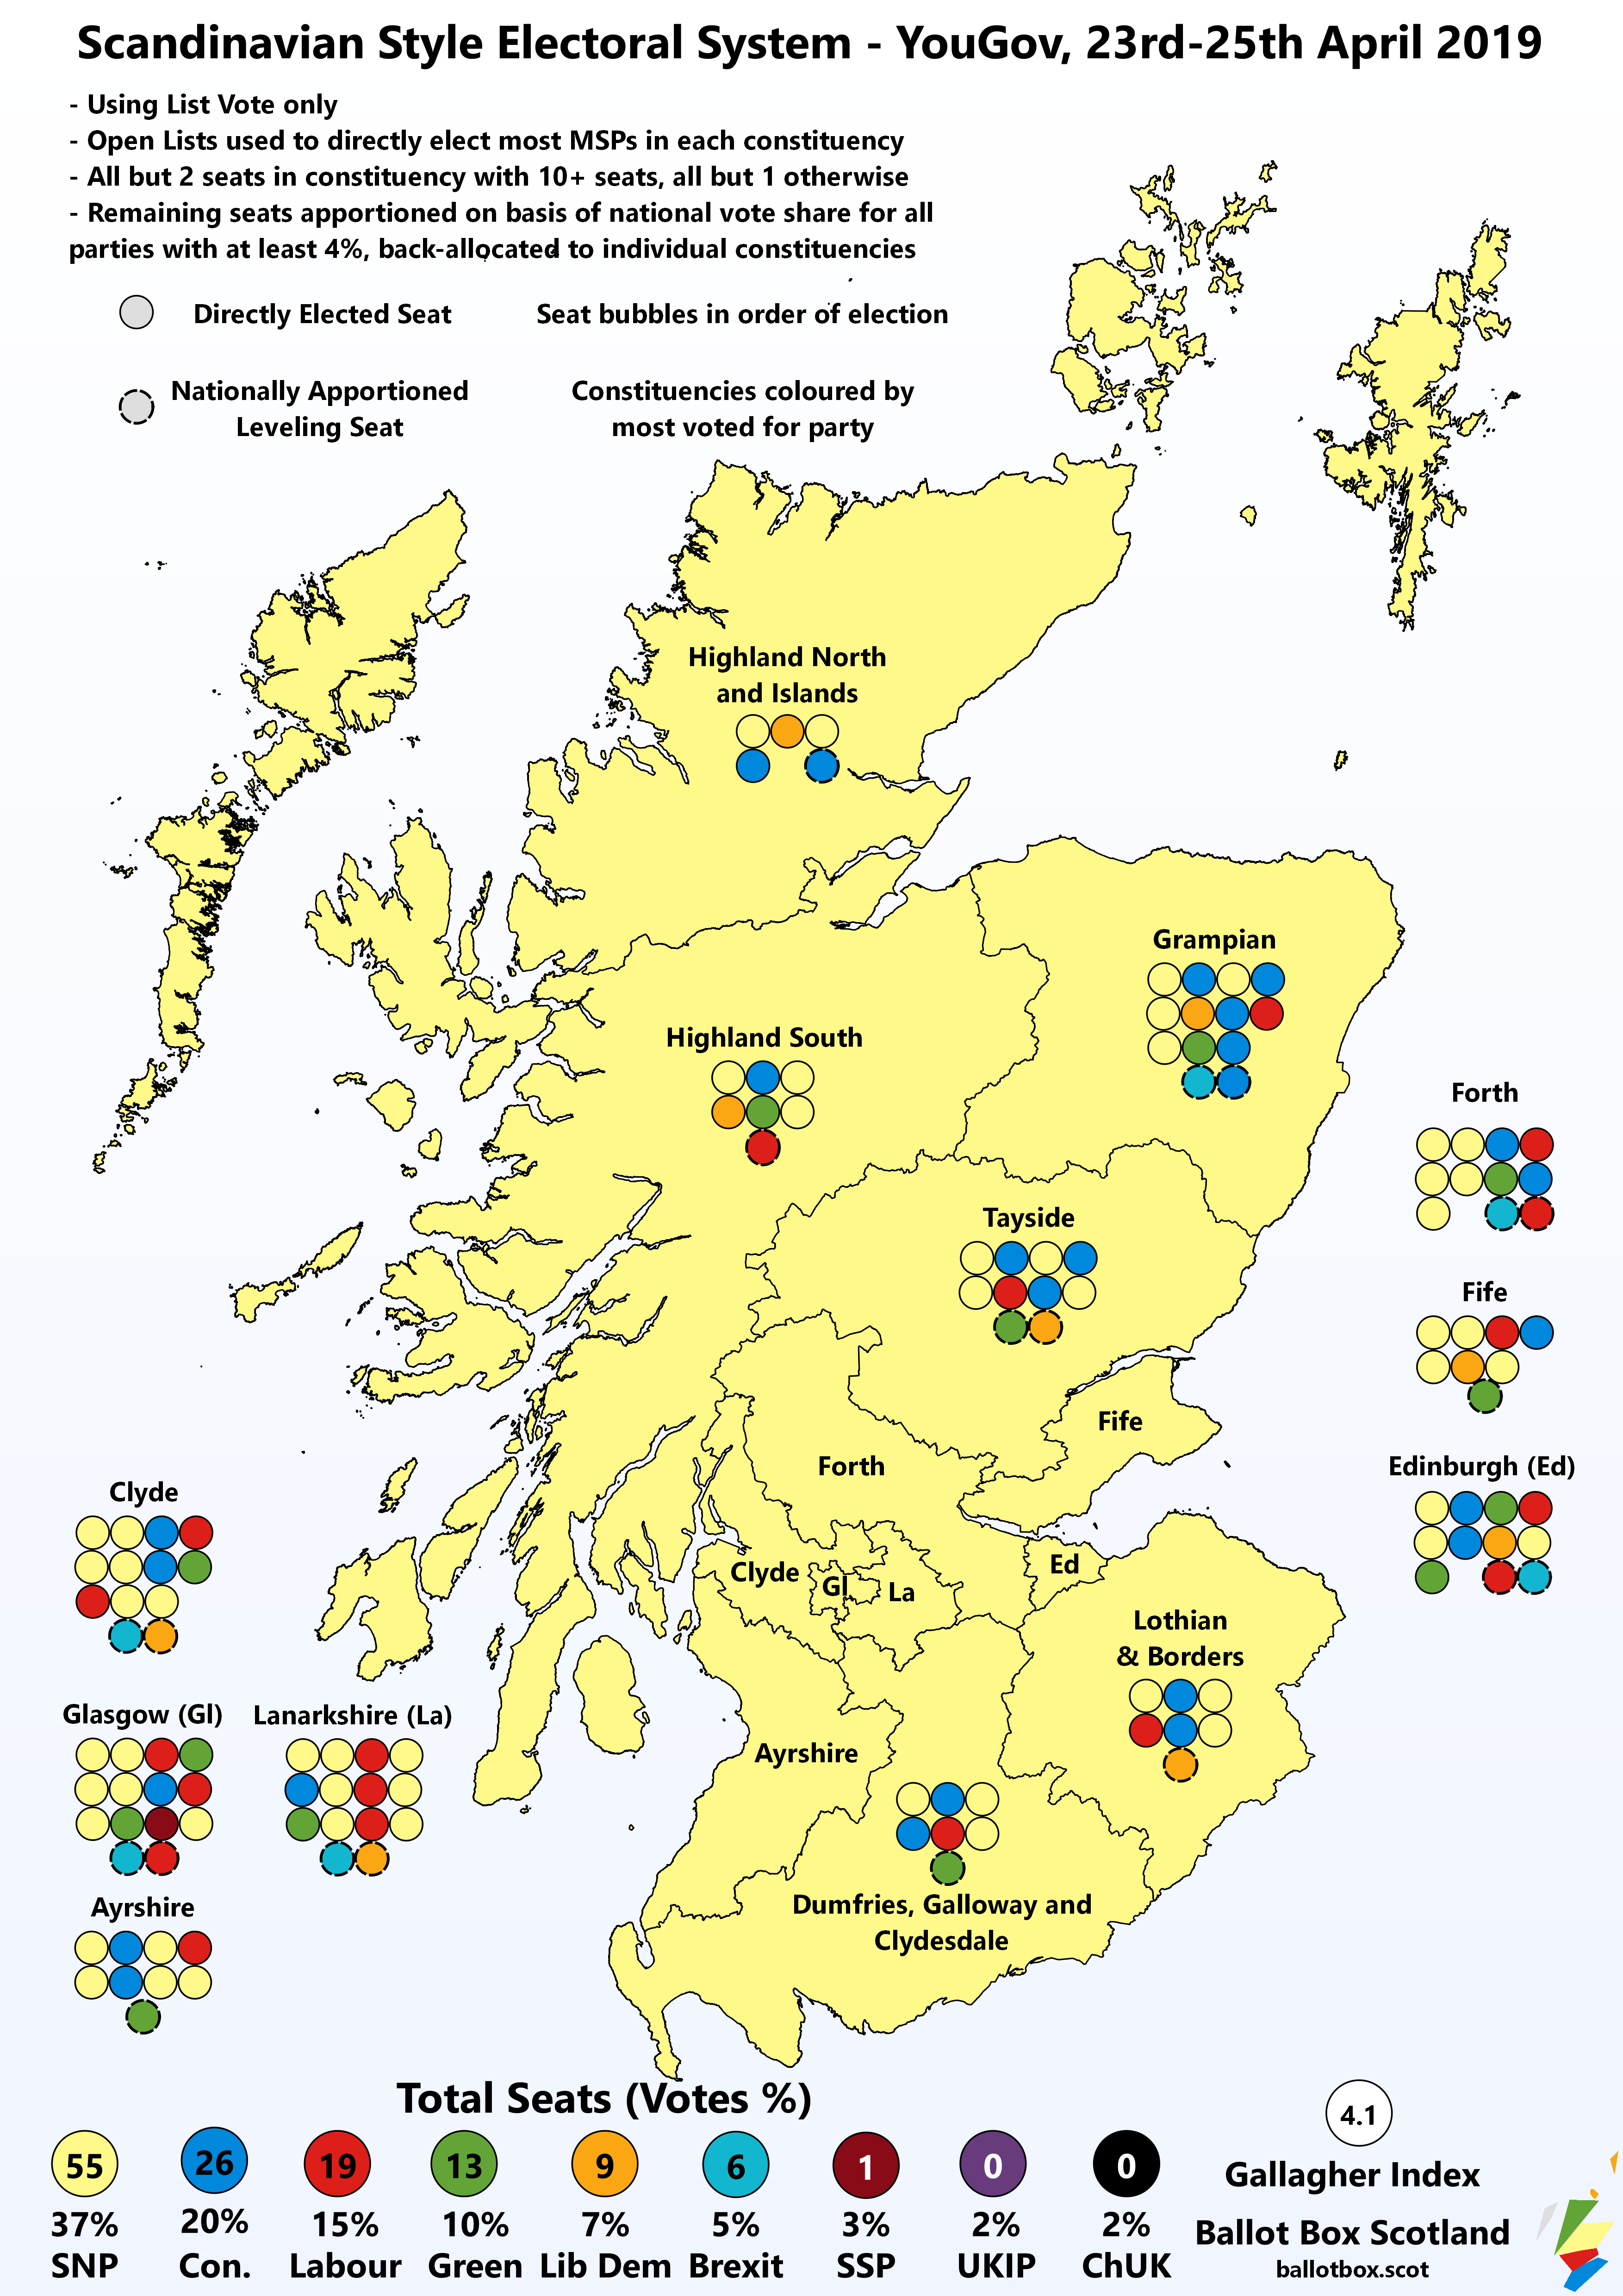
 As I now like to do, let’s do a brief comparison with a hypothetical more proportional system in line with Scandinavian countries (vs AMS projection);
- SNP – 55 (-8)
- Conservative – 26 (+1)
- Labour – 19 (+1)
- Green – 13 (+3)
- Lib Dem – 9 (+1)
- Brexit – 6 (+1)
- SSP – 1 (+1)
If you were agog at Brexit Party seats in the ordinary projection, get a load of that SSP seat here. Although they come in below the 4% national threshold, the model gives them enough votes in Glasgow for a seat. You can see a real life example of this in Norway where in 2017 two parties (the Greens and the Reds) won a single seat each in Oslo despite not crossing the threshold. Note as well this is the first time with the more proportional system that a pro-Independence majority is indicated.
 Westminster Voting Intention (Tracker)
- SNP – 43% (+3 / +6)
- Conservative – 20% (-7 / -9)
- Labour – 17% (-6 / -10)
- Lib Dem – 9% (+2 / +2)
- Brexit – 4% (+4 / +4)
- Green – 3% (+1 / +3)
- Change UK – 2% (+2 / +2)
- UKIP – 1% (nc / +1)
Moving over to Westminster and it’s a similar story. The SNP are on their best Westminster figure since 2017, as are the Lib Dems, whilst the Conservatives and Labour are on their worst. The Brexit Party do quite well here too, coming very close to matching their Holyrood figure. As ever I don’t do my own Westminster projections or make a big deal of them, but these figures would suggest a reduction to just one seat for Labour and perhaps just three for the Conservatives – oh, for Proportional Representation at this level, eh?
European Voting Intention
- SNP – 40% (+11)
- Labour – 14% (-12)
- Brexit – 13% (+13)
- Conservative – 10% (-7)
- Green – 7% (-1)
- Lib Dem – 6% (-1)
- Change UK – 6% (+6)
- UKIP – 3% (-8)
This is absolutely the most exciting part of this poll – the first Scotland-only bit of EU election polling! Depending on party, these figures range from “impressive”, through “disappointing”, onto “atrocious” and finally “downright cataclysmic”, in relative terms.
Undoubtedly this is a great poll for both the SNP, who are up substantially on 2014, and for the Brexit Party, who’d improve on UKIP’s performance to win a seat. The Greens and Lib Dems might be disappointed with their figures here, but at least they show only very small declines versus the last election. Change UK may be conflicted, with 6% distinctly impressive compared to the 2% for the actually more proportional Holyrood election, but still not enough to win a seat.
On the other hand, Labour, UKIP and especially the Conservatives are looking very sickly. Labour’s vote is estimated to be slashed by almost half but at least they come second. UKIP are basically dead in the water, having been supplanted by the Brexit Party. Meanwhile the Conservatives appear to have shed a huge chunk of the support they have at Holyrood and Westminster to the Brexit Party for EU purposes. For the party forming the UK government to be within 3% of the Greens and 4% of the Lib Dems and upstart ChUKers in national polling for any level is just astonishing.
Remember that of course these elections are going to be hugely impacted by the current Brexit shenanigans and very different to how they may have played out in less fraught times, and these figures should be viewed in that light, but they really are quite something. If we translate these into seats;
- SNP – 3 (+1)
- Labour – 1 (-1)
- Brexit – 1 (+1)
- Conservative – 1 (nc)
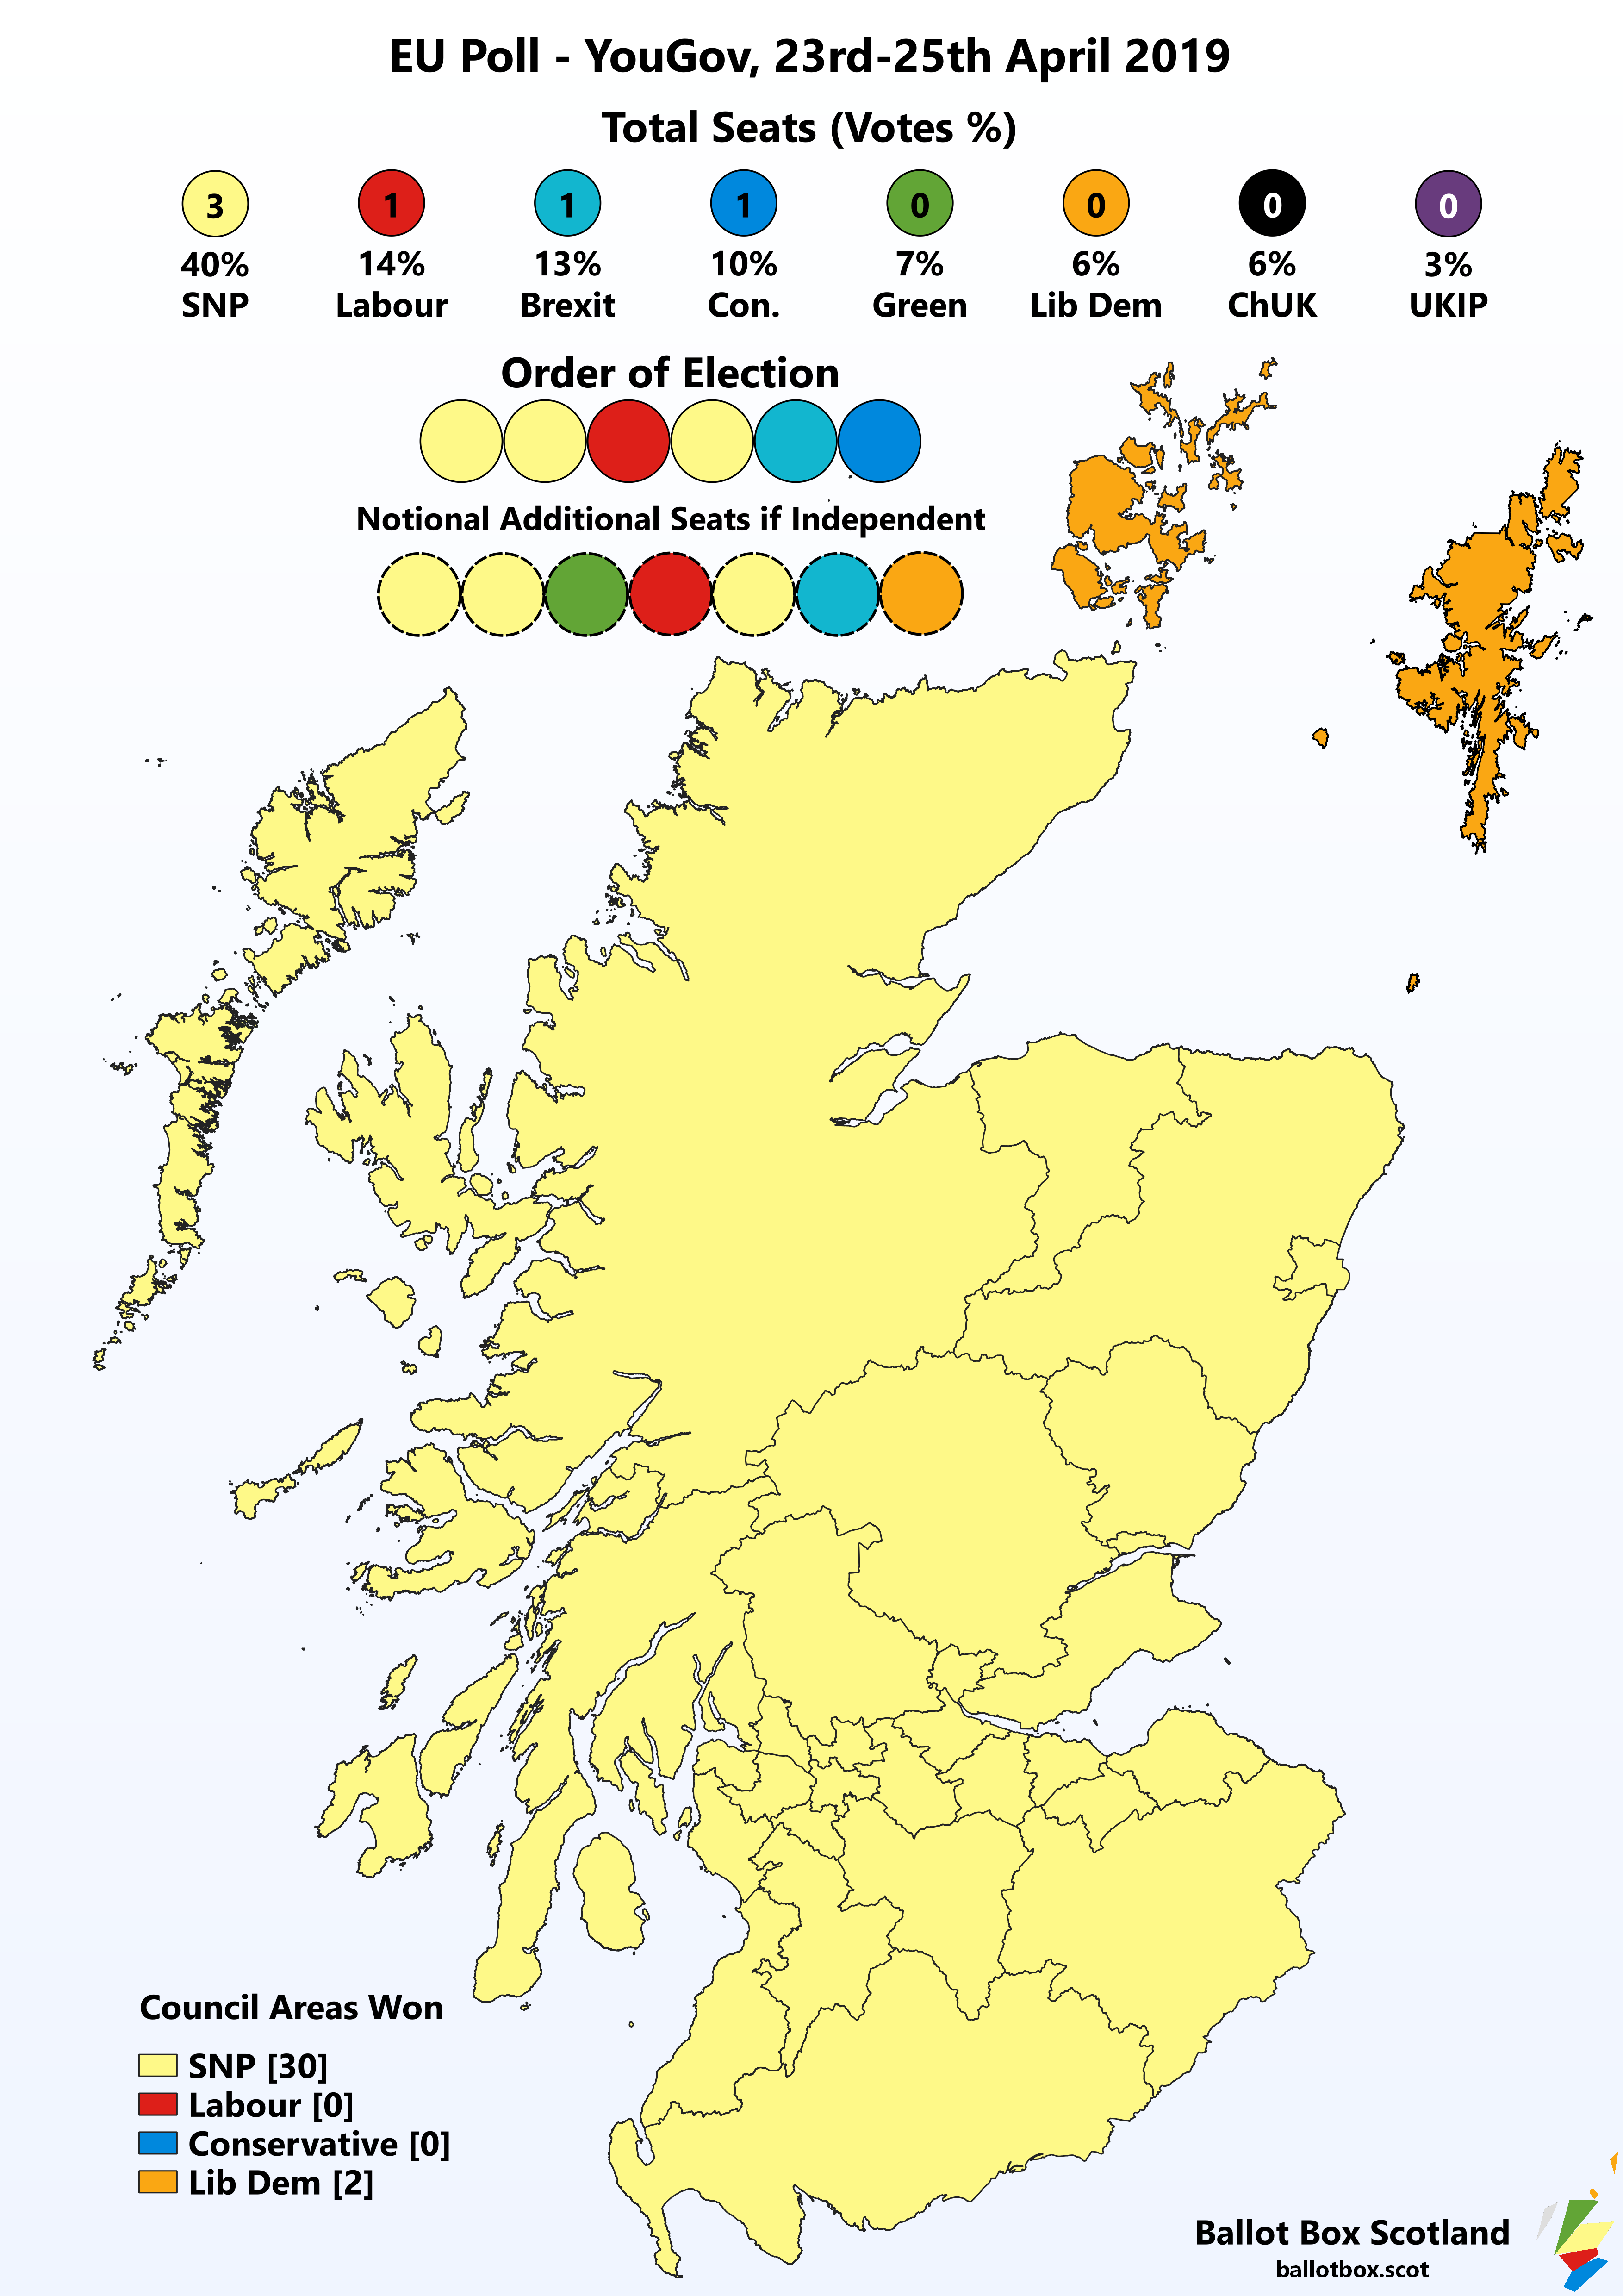
Note that although I haven’t represented it above for the sake of consistency, I had to delve into the tables to break the tie between SNP and Conservatives for seat 6. Also, I didn’t do any real calculator wizardry to work out the winner for each council area – with that level of SNP support versus everyone else, I just assume they’ll win everything except the Northern Isles, which will continue to vote Lib Dem until after the sun swallows the earth and the eventual heat death of the universe.
Just for fun, the figures for if Scotland had the 13 MEPs full EU member states of our size do (with similar need to tie break between Labour and Greens for order, plus Lib Dems and ChUK for seat 13);
- SNP – 6
- Labour – 2
- Brexit – 2
- Conservative – 1
- Green – 1
- Lib Dem – 1
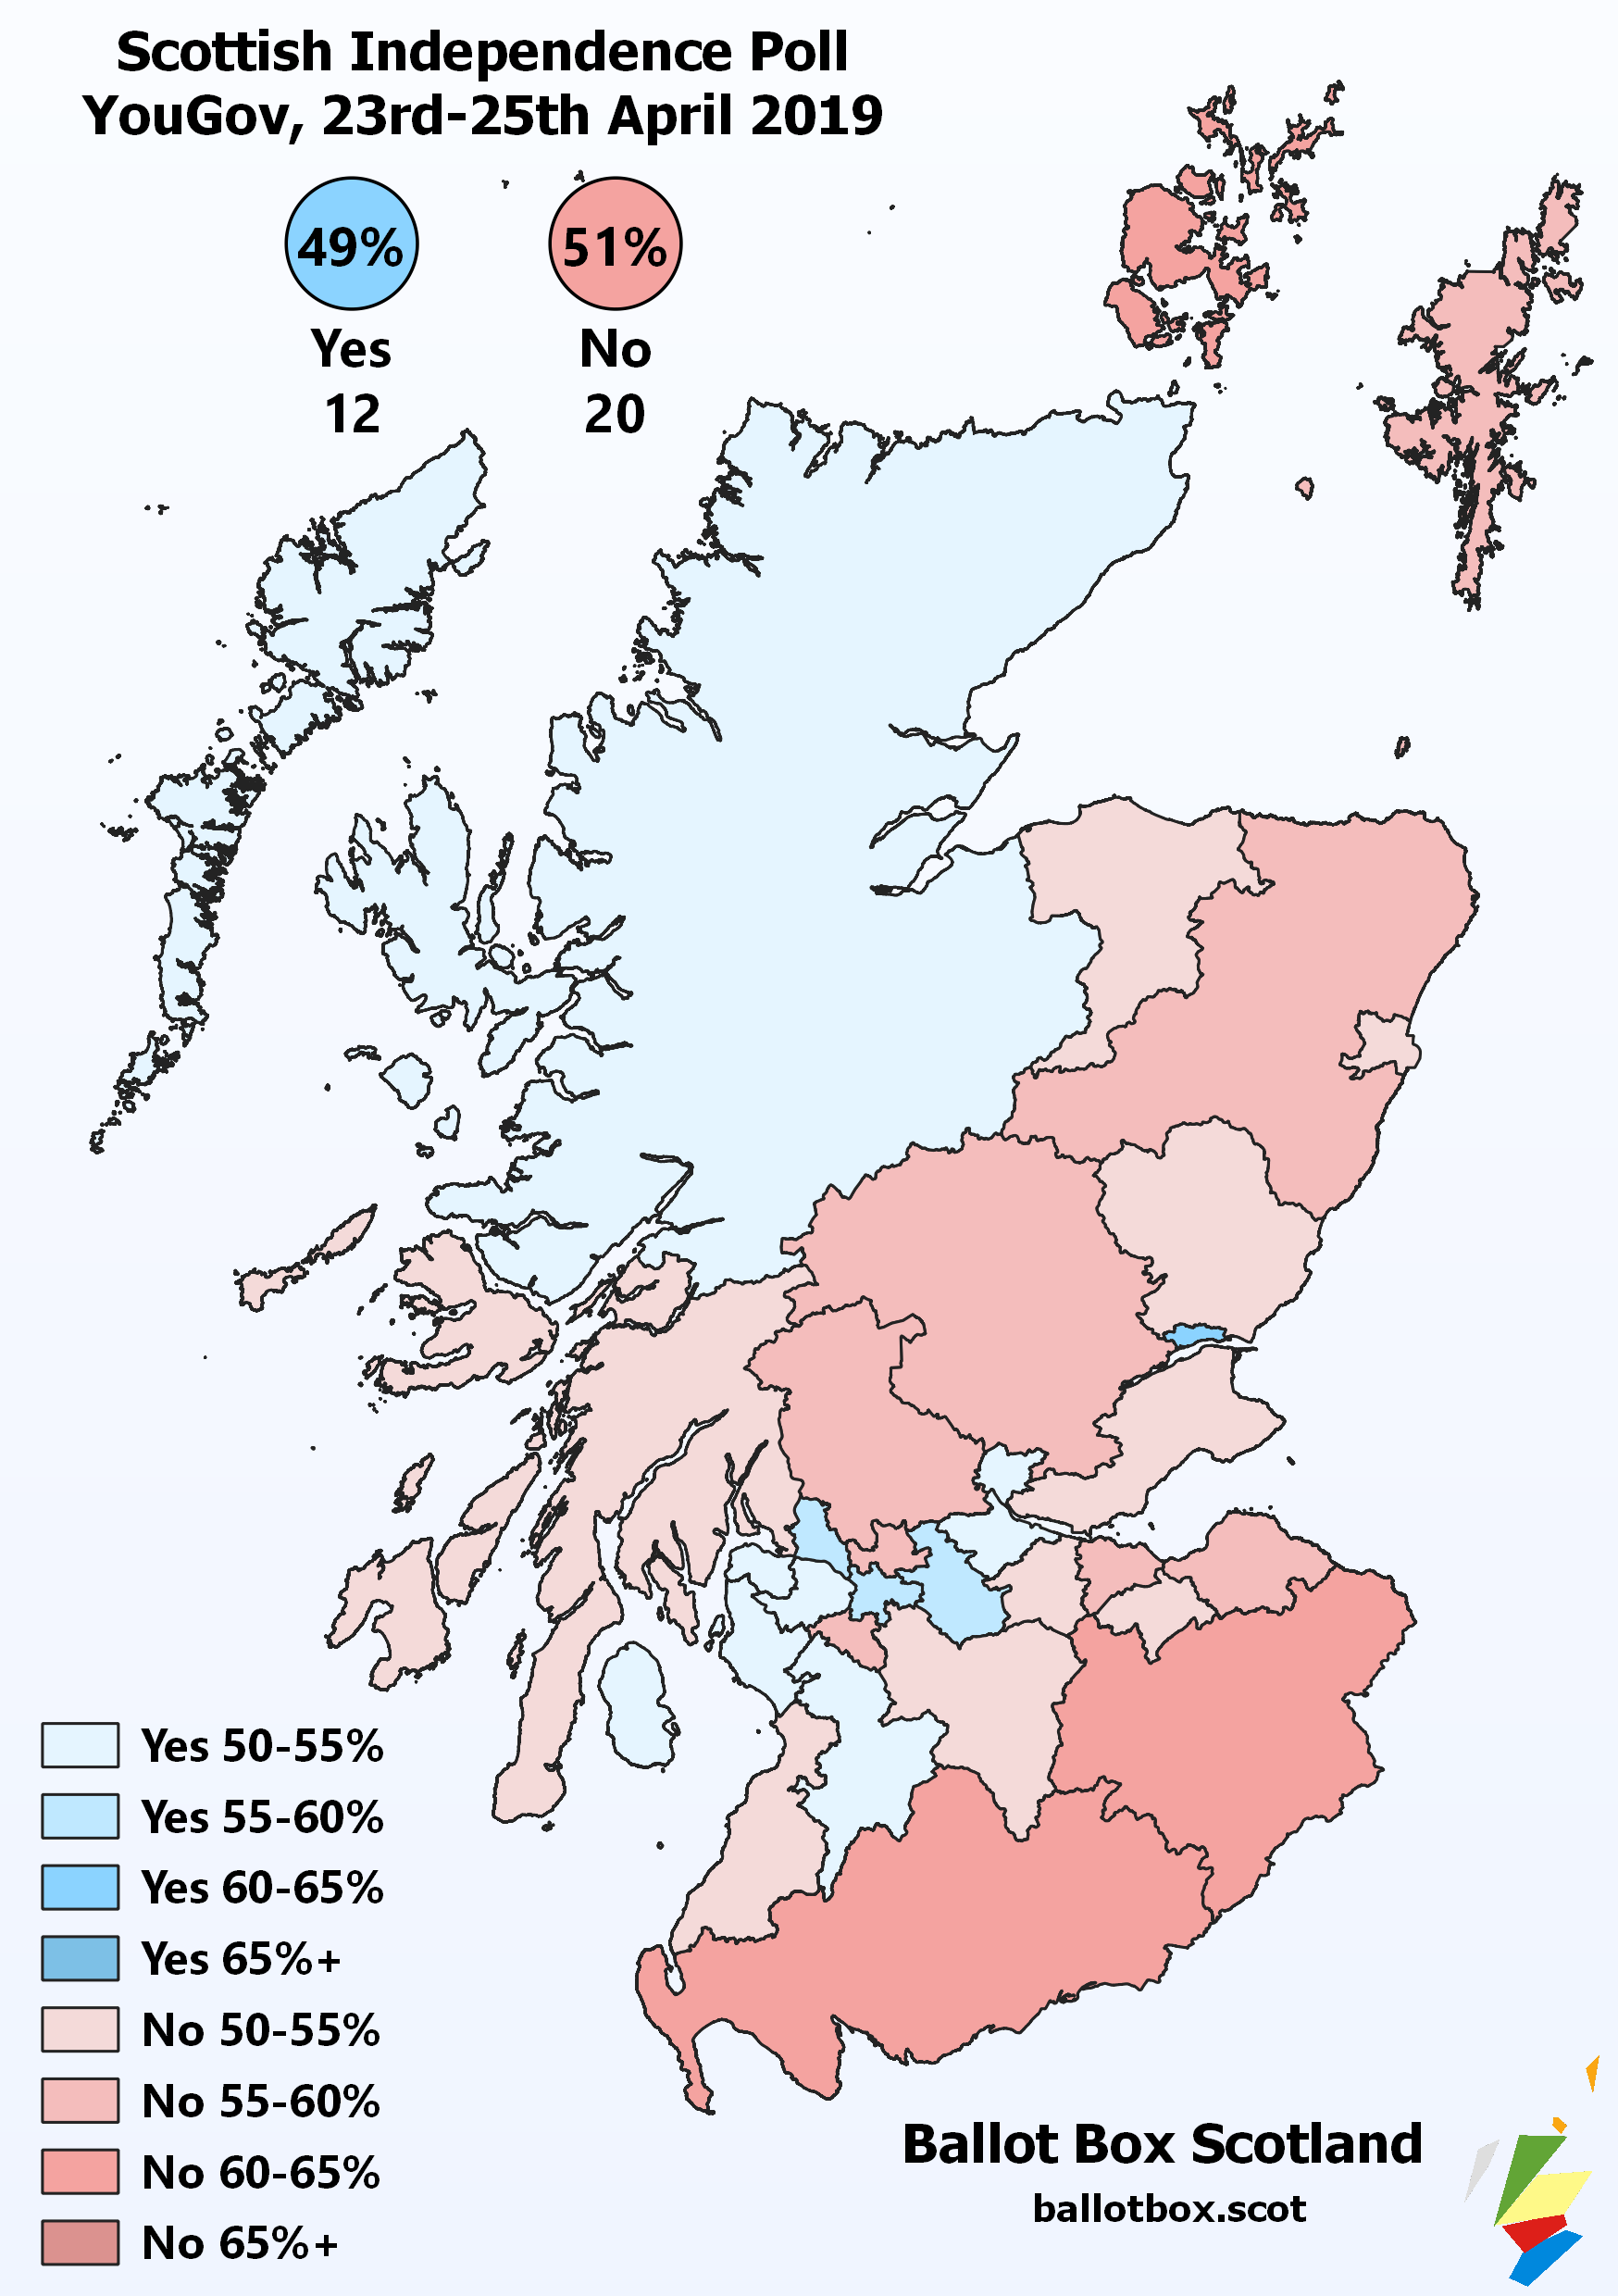
Independence Voting Intention (Tracker)
- Yes – 44% (+3)
- No – 45% (-5)
- Don’t Know – 7% (+1)
Excluding Don’t Knows (etc);
- Yes – 49% (+4 / +4)
- No – 51% (-4 / -4)
Although still showing a No majority, these pretty knife-edge figures caused a little bit of a stir on social media. The last time any poll showed the constitutional question to be this close was in April 2017. If they translated universally across Scotland compared to 2014, Yes would win in 12 Councils and No in 20.
Finally, on whether or not such a referendum should be held in the next 5 years;
- Should Not – 48% (-4)
- Should – 42% (+2)
- Don’t Know – 10% (+2)
So more Scots would prefer not to see another referendum within 5 years than would, but opposition has softened slightly since last June.