Background
Kicking off a succession of by-elections over the course of three weeks, Scotland’s first autumn ballot was in South Ayrshire’s Girvan and South Carrick. Although it was the SNP councillor standing down, this is a ward with a very popular Independent councillor (Alec Clark) who would easily win a single-seat election if he was to have been on the ballot. Obviously he wasn’t, so instead I expected this to be a Conservative vs SNP head-to-head.
Re-calculate the 2022 results for a single candidate without Clark and the SNP would have won by the skin of their teeth by a 0.9% margin, though the Conservatives had a stronger but still narrow 2.9% advantage if keeping both candidates in and summing their votes. With both parties polling relatively badly at the moment, but the Conservatives tending to benefit from the conditions in by-elections, I had this pegged as a likely win for them.
Headline Results
Councillors and Key Stats
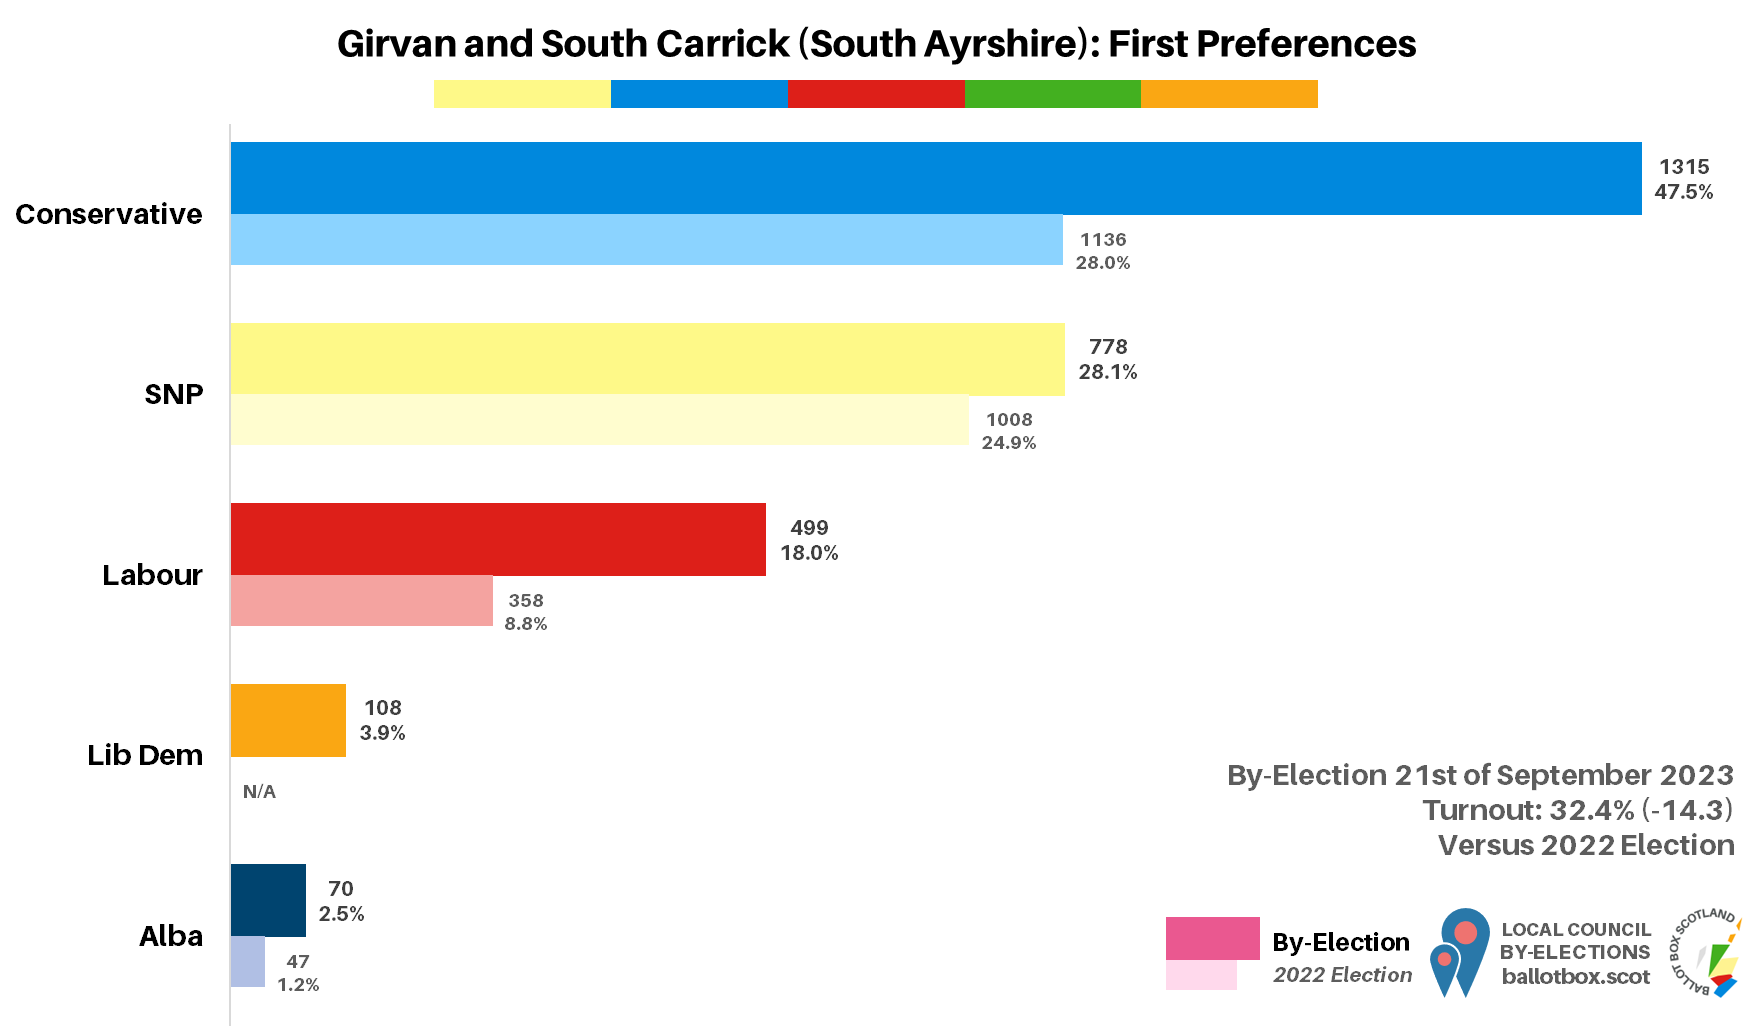
1 Councillor Elected: Conservative: Alan Lamont
Change vs 2022 (notional): Conservative gain from SNP
Change vs vacating: Conservative gain from SNP
Turnout: 32.4% (-14.3)
Electorate: 8,653
Valid: 2770 (98.1%)
Spoiled: 32 (1.1%)
Quota: 1386
2 Continuing Councillors:
⚪Independent: Alec Clark
🔵Conservative: Gavin Scott
Candidates
Conservative: Alan Lamont SNP: Joseph McLaughlin
 Lib Dem: Jamie Ross
 Labour: Nicola Saxton
 Alba: Denise Sommerville
First Preferences
Note: Two independent candidates, Alec Clark (31.5%) and Todor Radic (5.7%) accounted for 37.2% of the vote in 2022.
Chalk another one up in the “absolutely solid BBS predictions” column, because the Conservatives did indeed win a pretty stonking victory in this by-election, gaining nearly 20% of the vote in the simplest comparative terms. With all the spare votes from 2022 Independents sloshing about, every party making a repeat appearance grew as well. For the SNP though that was only very modest, whilst Labour gained about three times as much in absolute terms, allowing them to double their vote in relative terms. Alba similarly more than doubled their share, although they had the smallest positive swing overall, and placed behind the Lib Dems who were contesting the ward for the first time.
Given how dire a time the Conservatives are having in national polling, such a big swing in their favour certainly sticks out. Looking at Westminster polling, their losses are on a par with the SNP in the region of -9% each, whilst they’re a little better off on the Holyrood list, at around -7 versus -9 for the SNP, though in both cases that amounts to losing a greater proportion of their previous vote. So what went on here that led to it seemingly bucking the trend so significantly?
Well most importantly, it was that massive chunk of the vote that had plumped for Independent candidates in 2022. Support for Alec Clark in particular was greater than for any individual party, which means an election where he wasn’t on the ballot simply isn’t really comparable to one where he was. That’s partly why I go to the bother of re-calculating 2022 results excluding such candidates in by-election previews on BBS. I don’t usually get massively detailed on the resulting figures, but I thought it might be useful to do so here.
The chart below effectively shows three versions of the 2022 results excluding those Independent candidates, plus the by-election result for comparison. The first version is simply excluding the Independents and re-distributing their votes; remember that because we have such detailed data from machine counts we can do this “perfectly” – this isn’t an estimate, it’s the exact figures based on how voters marked their ballots. This includes a portion of votes that didn’t transfer because voters didn’t mark any later preferences.
What we don’t know is why voters didn’t mark later preferences – was it deliberate, or did they not understand the system? Would they have not voted in the absence of the people they voted for, or would that absence have forced another choice? Since we only have their ballots but not their motivations, these are the figures I use for re-calculations, rather than assuming or inferring how those Didn’t Transfer votes might otherwise have been used.
However, we can come up with some other figures if we assume motivations and patterns. The second set of figures then is if we just discount that pile of Didn’t Transfer votes entirely – i.e. we assume all such exhausted ballots were deliberate and those voters would have turned their nose up at all other candidates and either not voted or spoiled their paper. The third set assumes everyone would have marked further preferences if they understood the system or situation better, and re-distributes the Didn’t Transfer ballots on the same pattern as those that did transfer.
Although none of these will give us the definite exact results of the 2022 election without those Independents, they do all give us a slightly clearer starting point for working out the “real” swing than comparing against the ballot that did have those Independents. In all cases, the Conservatives, SNP and Labour have significantly higher shares than when the Independents were included, with the Conservatives having the highest percentage point benefit regardless of method.
There are three things to take away from this. Firstly, Labour and Alba only really have very marginal changes compared to an Independent-free iteration of 2022. Secondly, the Conservative swings, although still respectable, are much less significant. Thirdly, the SNP swings are both much more significant and much more negative. Overall then, the Conservatives did a bit better, the SNP a lot worse, and Labour and Alba about the same as they would have, with the balance made up by the Lib Dems who obviously don’t compare since they didn’t stand last time.
That might still leave you with the question of well, if both the Conservatives and the SNP are doing badly in polling, why did the Conservatives still make gains even comparing this way, whilst the SNP had significant losses? That’s where the effects of by-election conditions and constitutional polarisation kick in.
On by-election effects, I’ve said it a million times by this point, but the low turnout nature of by-elections gives the Conservatives a slight advantage and the SNP a slight disadvantage. As turnout reduces, it reduces most amongst groups already least likely to turn out, including younger and poorer voters, who tend to vote SNP. That means more of the remaining vote is made up of higher turnout groups, including older and wealthier voters, who tend to vote Conservative. The effect of this isn’t huge, it’s a few % either way, and it doesn’t always lead to better Conservative and worse SNP shares as that depends on wider context, but it matters.
On constitutional polarisation, Scotland has spent nearly the past decade with voters sorting themselves relatively neatly into the SNP versus “Whoever Is Their Strongest Competition Locally” camps. In rural South Ayrshire, that competition of course comes from the Conservatives. That has allowed them to partly defy gravity in this by-election in a way that isn’t going to be possible elsewhere. People on Twitter very often like to pretend by-elections in a single ward (out of 355 in Scotland’s case) somehow disprove national polling, but that’s simply not the case, any more than the Conservatives beating the SNP and Labour here in 2022 meant they beat them nationwide that year (which they very much did not). That doesn’t change the fact this was a good outcome for the Conservatives, but this outcome also doesn’t change that they are currently on track for significant losses at Parliamentary elections.
Transfers
Two-Candidate Preferred
With the Conservatives starting only 71 votes (2.5%) short of quota, there was no way they wouldn’t win after transfers. It nonetheless took them all the way up to Labour’s elimination to cross the line – something I’m thankful for as a nerd as it meant we can still see the two-candidate preferred point despite lack of machine counting. Although I talked earlier about constitutional polarisation, the Conservatives actually only picked up one more vote than the SNP from each of the Lib Dem and Labour elimination stages.
Indeed, more votes (marginally for the Lib Dems, much more significantly for Labour) exhausted than went individually to either of the two leading parties. That perhaps drives home that in addition to constitutional polarisation, there’s also a significant anti-Conservative polarisation in Scottish politics at the moment, perhaps reflecting that the Scottish Conservatives have a roughly four-to-one unfavourable-to-favourable rating at present.
Detailed Results
As this by-election was counted by hand rather than machine, we unfortunately don’t get the data necessary to see the results by polling district or the raw second preferences for each candidate.
First Preference History
The only thing we can really look at in this section then is how first preference votes have shifted between elections. With the caveats in mind about lack of Independents discussed at length earlier, the Conservatives managed their best result yet, whilst on the face of it the SNP and Labour both had their second best result.
As I said, this is just the first of three by-elections on the trot. Next week there will be a by-election for Highland’s Tain and Easter Ross ward. The count for this will be on the Friday morning when I will be at an all day event for my day job, so coverage of that will be later on that evening or even Saturday.
If you find this or other Ballot Box Scotland output useful and/or interesting, and you can afford to do so, please consider donating to support my work. I love doing this, but it’s a one-man project and takes a lot of time and effort. All donations, no matter how small, are greatly appreciated and extremely helpful.
(About Donations)