

Kicking off a new year in polling, we’ve got another from Survation (link to tables) on behalf of Scotland in Union. Strictly speaking since fieldwork tends to be front-loaded, this is mostly from late 2022, but the BBS norm for tracking is to use the concluding date, so this counts as a 2023 poll – just! They also commissioned the previous Survation poll, and the same points I made in the intro to the analysis piece for it apply, about them being a more explicitly partisan body than papers, and long-standing BBS policy not to cover their non-standard constitutional polling.
The previous Survation covered the 28th and 29th of September last year. Changes are shown as (vs that poll / vs last election).
Regional Vote
Survation continue to align with Savanta in putting the SNP in the low 30%’s for this vote, though with a gain of two points versus their previous poll. Combined with a 1% dip for Labour, that creates a much wider gap between the two than in September, though one that if repeated at an election would be the closest result between the SNP and the second placed party since 2007.
Similarly, a gap opens back up between the Conservatives and Greens, who last time had been neck-and-neck. Nonetheless the relative fortunes of the two parties remain the opposite way about to their placing – adding a point still has the Conservatives losing more than a third of their vote relative to 2021, whilst even with losing two the Greens would have a record result, growing by half compared to the election.
There’s no change for the Lib Dems, though they’d be very happy with this figure, which lies at the upper end of their polling range. Survation also have one of the wider fields of minor parties, in which the only real change is a slight bump for Alba. They tie with Reform UK and aren’t that far ahead of UKIP, two parties likewise struggling to make any serious impact.
Constituency Vote
No particularly dramatic shifts in the constituency side of things either, with tiny decreases for the SNP and Labour, and slightly larger gains for the Conservatives and Lib Dems. These kind of swings would be unlikely to change a huge amount at an actual election, though the lower share for the SNP is the kind of thing that could help narrowly stave off a loss or two for the Conservatives.
Seat Projection
Projecting that into seats might give us something like this:
Please see this page for how projections work and important caveats.
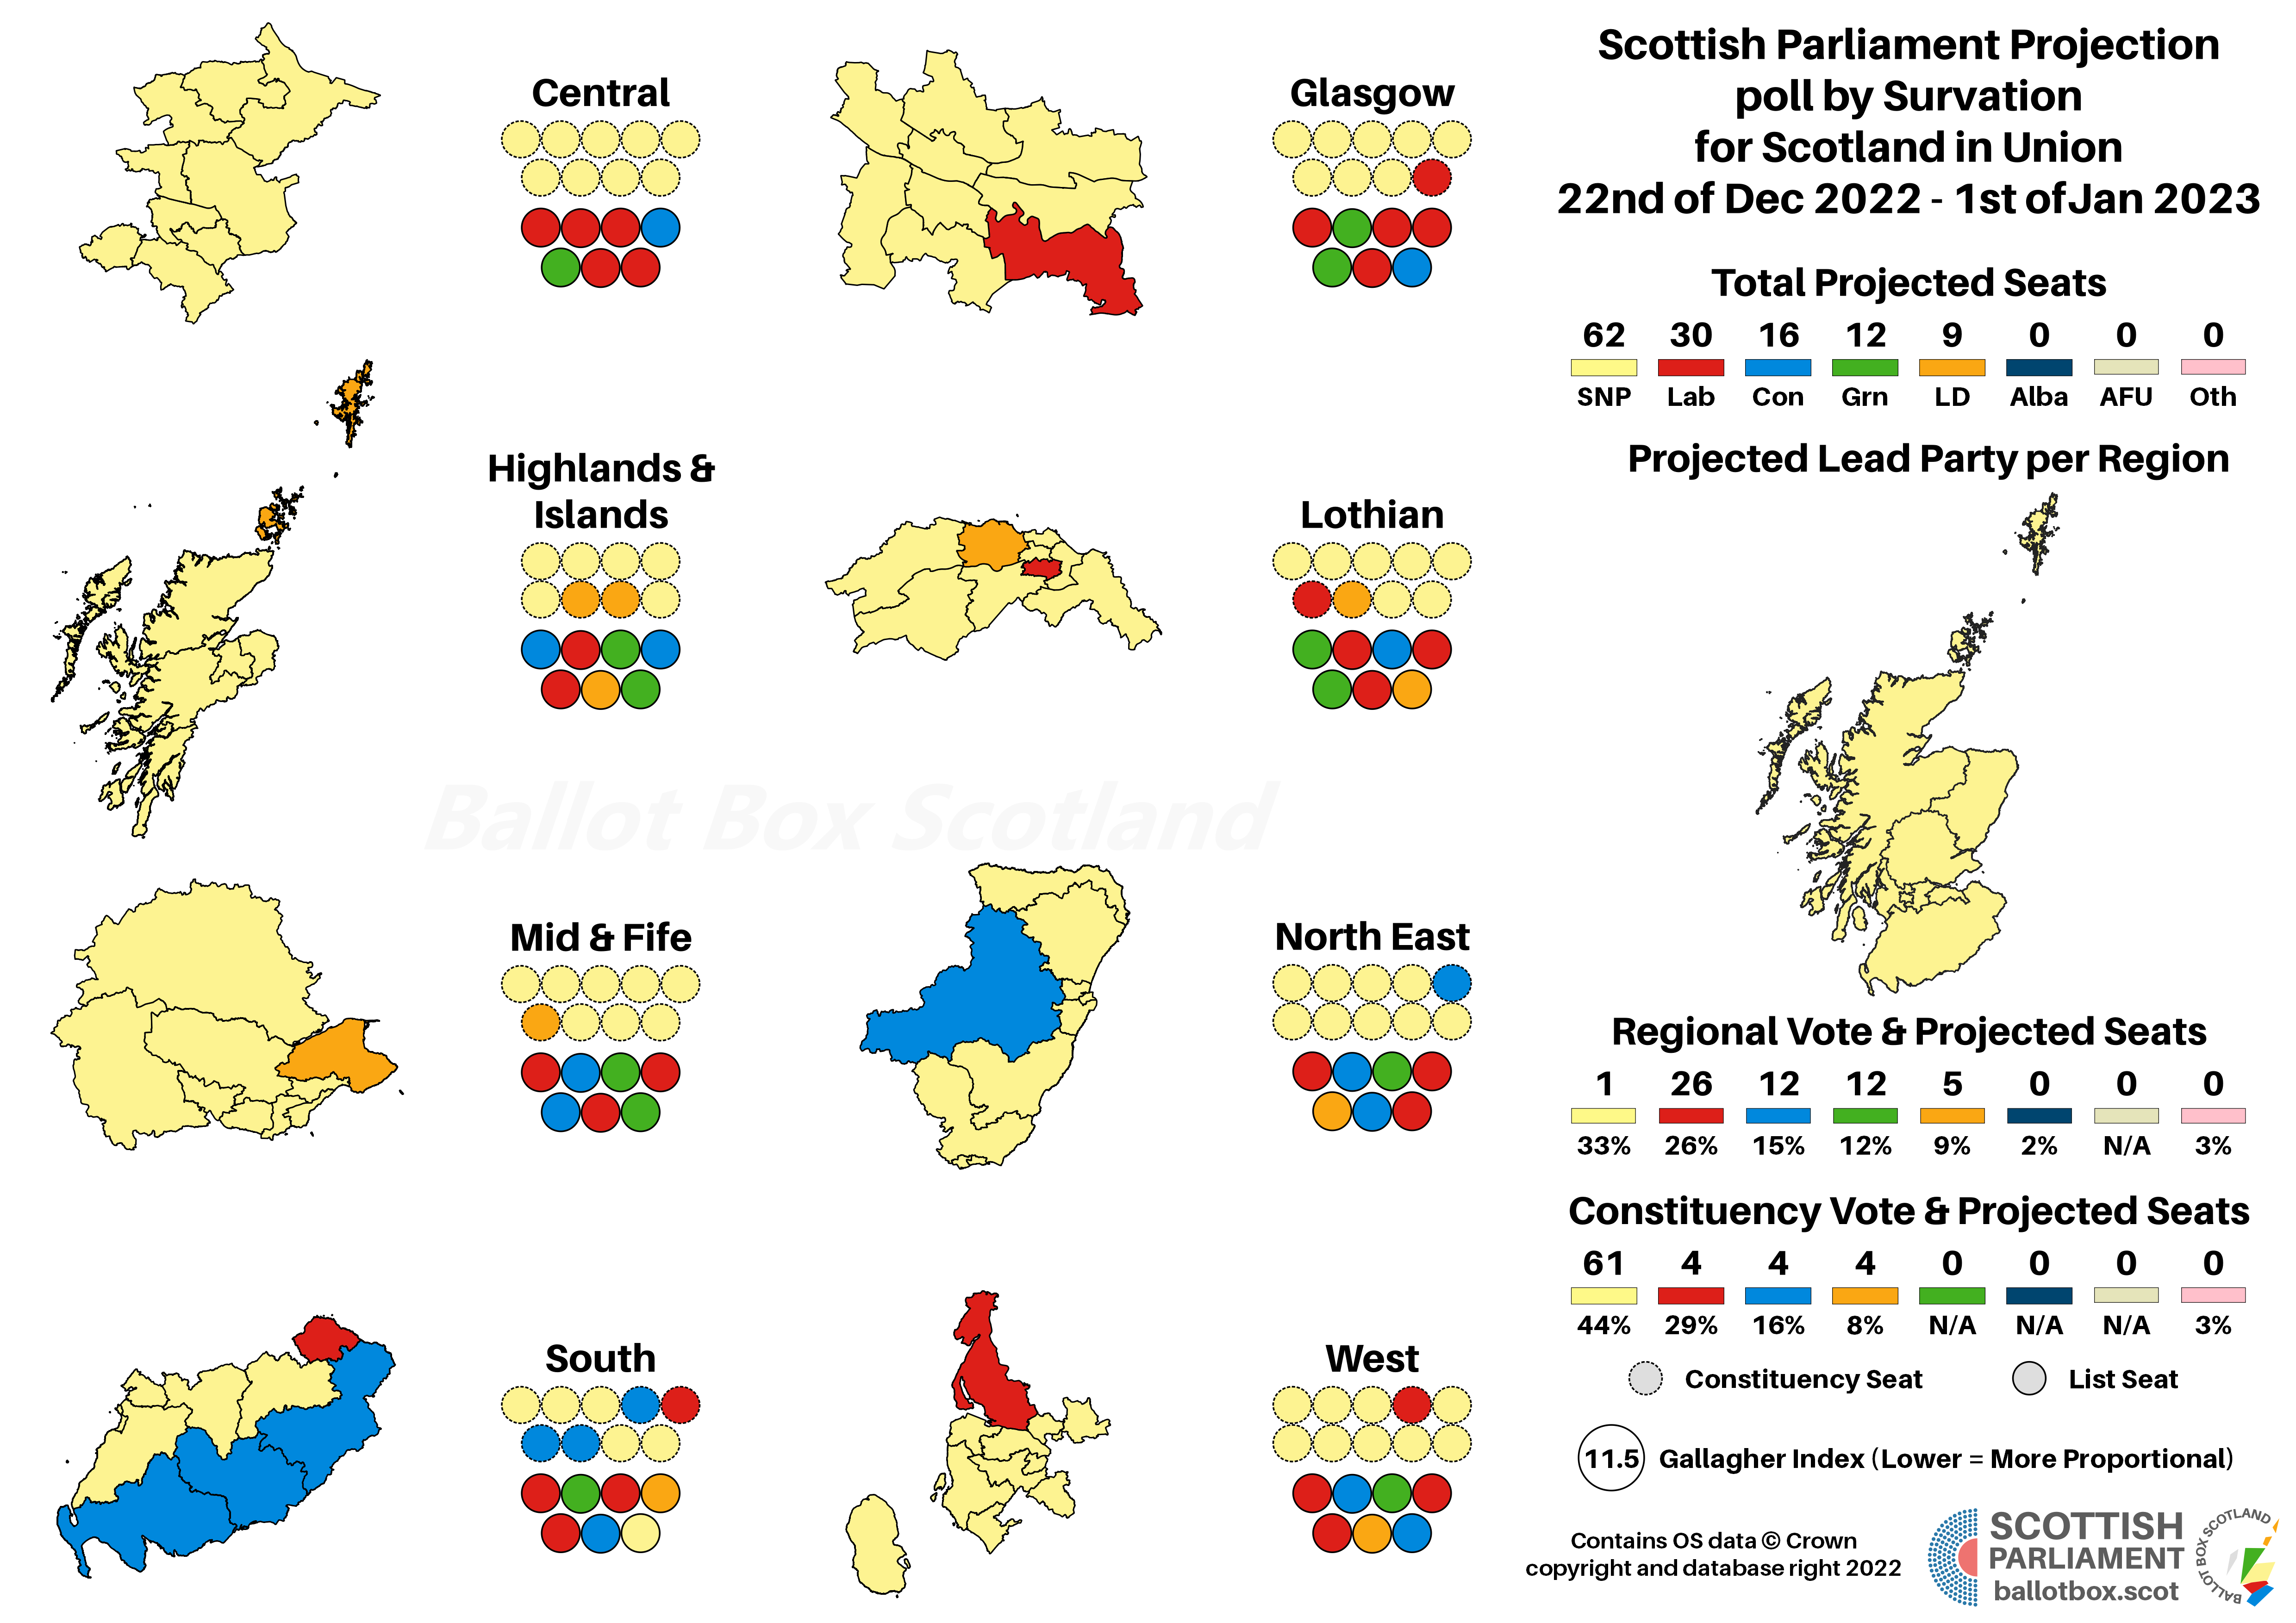
These small changes combine ensure that the Conservatives place comfortably ahead of the Greens rather than the tie in the previous projection, whilst the Lib Dems also make a small advance. The SNP’s constituency dominance nonetheless helps to preserve a clear majority for their co-operative government with the Greens.
It’s really especially dull on the Westminster figures where all that seems to have happened is some rounding and/or margin of error based wiggling that adds 1% to the Conservative tally. They would still be well below their 2019 result, as would the unchanged Lib Dems. What now looks like the key SNP-Labour contest thus remains at the same 13% gap, a level I reckon is just beyond what Labour need to start seriously flipping seats beyond what they briefly regained in 2017.
With a “de facto referendum” still the talk of the political town in Scotland, the combined SNP-Green total here of 45% falls well short of the voting majority they’d be aiming for.
As noted above, and explained in the linked editorial policy page, I do not cover Scotland in Union’s non-standard Independence polling. I likewise noted in my analysis of the previous poll that there’s an obvious political and campaigning incentive for them to try and get polls that look most favourable to their side. However, I would suggest getting polling that looks so much more favourable to the Union than literally every other poll is really showing diminishing returns.
Political journalists are increasingly aware of the fact it’s incomparable, and therefore not of much use. I’ve had folk at two national papers (neither of which are The National, lest anyone think to make a clever remark!) explicitly tell me they know the non-standard question is nonsense, and as a result they’ve either ignored or barely mentioned it in their own coverage.
Perhaps, reflecting on my consistent argument that in order to meaningfully change opinion either way the campaigns need to actually discuss matters of substance, the thousands of pounds Scotland in Union sinks into this kind of useless polling could be better spent? Far be it from me to offer direct campaigning advice, but the entire poll reads as a way to get attack lines on the Scottish Government and the SNP, and whilst that’s perfectly legitimate in and of itself, it’s perhaps the kind of activity best left to opposition parties and the media. For an organisation whose raison d’être is to maintain the Union, perhaps producing things that extol the virtues and benefits of the Union itself might be sensible.
Hypotheticals
As ever, the last little bit of analysis concerns those hypothetical and more proportional voting systems that I have a bee in my bonnet about here at BBS. The fact Westminster uses pure FPTP is an affront to democracy, and though Holyrood fares far better, AMS is still deeply imperfect. The examples here simply transpose the poll findings onto more proportional voting systems – the reality is that different systems would of course result in different voter behaviour.
For the moment, although the maps are useful for illustrative purposes, I’m opting just to show these hypotheticals as charts. It’s very time consuming making maps, and for these pure hypotheticals, it’s possibly a bit overkill.
If you always read these little hypothetical bits, you should know the story here – you can make AMS better, but anything with an FPTP element is going to heavily favour any party with a 15% lead on that vote. Though less lopsided than the existing system, it’s still a very comfortable majority for the Pro-Independence parties at 78 to 67.
That’s absolutely not the case with the fully proportional (and driven only by the list vote) model, where the combined vote lead for Pro-Union parties gives them a seat lead of 68 to 61.
Scandinavian Style Westminster
Whereas the reality of FPTP would likely still hand the SNP an absurdly high proportion of MPs, moving to PR for Westminster would naturally leave the SNP short of a majority, whilst ensuring not just fair representation for Labour but, as is democratically right, minimising risk of wipeout for the Conservatives too.
If you find this or other Ballot Box Scotland output useful and/or interesting, and you can afford to do so, please consider donating to support my work. I love doing this, but it’s a one-man project and takes a lot of time and effort. All donations, no matter how small, are greatly appreciated and extremely helpful.
(About Donations)


