There’s been a bit of a lull in my analysis pieces for the 2026 election. I did all the most important stuff first, and then set about making sure the full results, for both votes, in every constituency, were available on the website. At the risk of flogging this horse to death, you will note that is information you will find basically nowhere else (until the good folks who maintain the relevant Wikipedia pages add it there too!) Our electoral administration isn’t set up to publish it in live time like a normal country, and that enables the near-complete ignoring of half the votes cast by the media. This is bad and needs to be addressed ahead of 2031.
Anyway! In this piece, we’re getting into the weeds of one of my favourite topics: electoral reform. With this Scottish Parliament election the most disproportionate yet, it’s more important than ever to think about what we could do differently to deliver a fairer, more representative outcome. I also undertook this exercise after the 2021 election, and as a bit of “bonus” content in poll analysis pieces, highlighted the projection into these different systems.
Methodology Note
Throughout this piece, I’ll be referring to the “Gallagher Index” (GI). This is a measure of disproportionality, with 0 representing perfect proportionality, and higher numbers greater amounts of disproportionality. For comparative purposes, the 2024 UK General Election had a staggering 23.6 on the index, the most disproportionate it has ever been. I have however been very slightly lazy and lumped all parties outside the Holyrood Six as a single “Other” bloc, which marginally increases the GI versus exhaustively doing the calculation including them individually.
In every case, the Regional List Vote as it was in this year’s election is being used to calculate alternative results and the GI. I know some people get a touch petulant about that, but there are good reasons for it. One, it’s mathematically and legislatively how the Additional Member System works right now. The total constituency vote is a mere curiosity which does nothing to determine the overall distribution of seats, because it doesn’t matter in each constituency whether you win by 1 or 10,000 votes. However, that level of difference in the list vote can make or break your chances of an additional seat.
Two, we can’t use the constituency vote anyway because it’s data deficient. Most importantly, the Greens largely do not stand in constituencies, and even if they did, other minor parties largely did not. The SSP may be a tiny shell of a party, for example, but there are some folk dedicated enough they’d have given them both votes if they could.
Three, we shouldn’t use the constituency vote even if it wasn’t data deficient. It would completely wreck proportionality, because for all the theorising about tactical voting on the list, first past the post remains the undefeated champion of tactical incentives. Given how FPTP-centric the UK’s political system is, tying the proportionality in part to a non-proportional vote would lead to grotesque distortions, as voters overly-fixated on their local result would still vote tactically.
List vote results are included in each chart to give an easy visual comparator of proportionality. If you hover over the bars, you may notice a slightly different figure from the label. That’s because I’m only showing proportionality between those parties that won seats, thus ignoring the roughly 5% of voters at each election that voted for unsuccessful micro parties and Independents.
Actual and Ideal Result
Actual AMS Result: GI 13.7
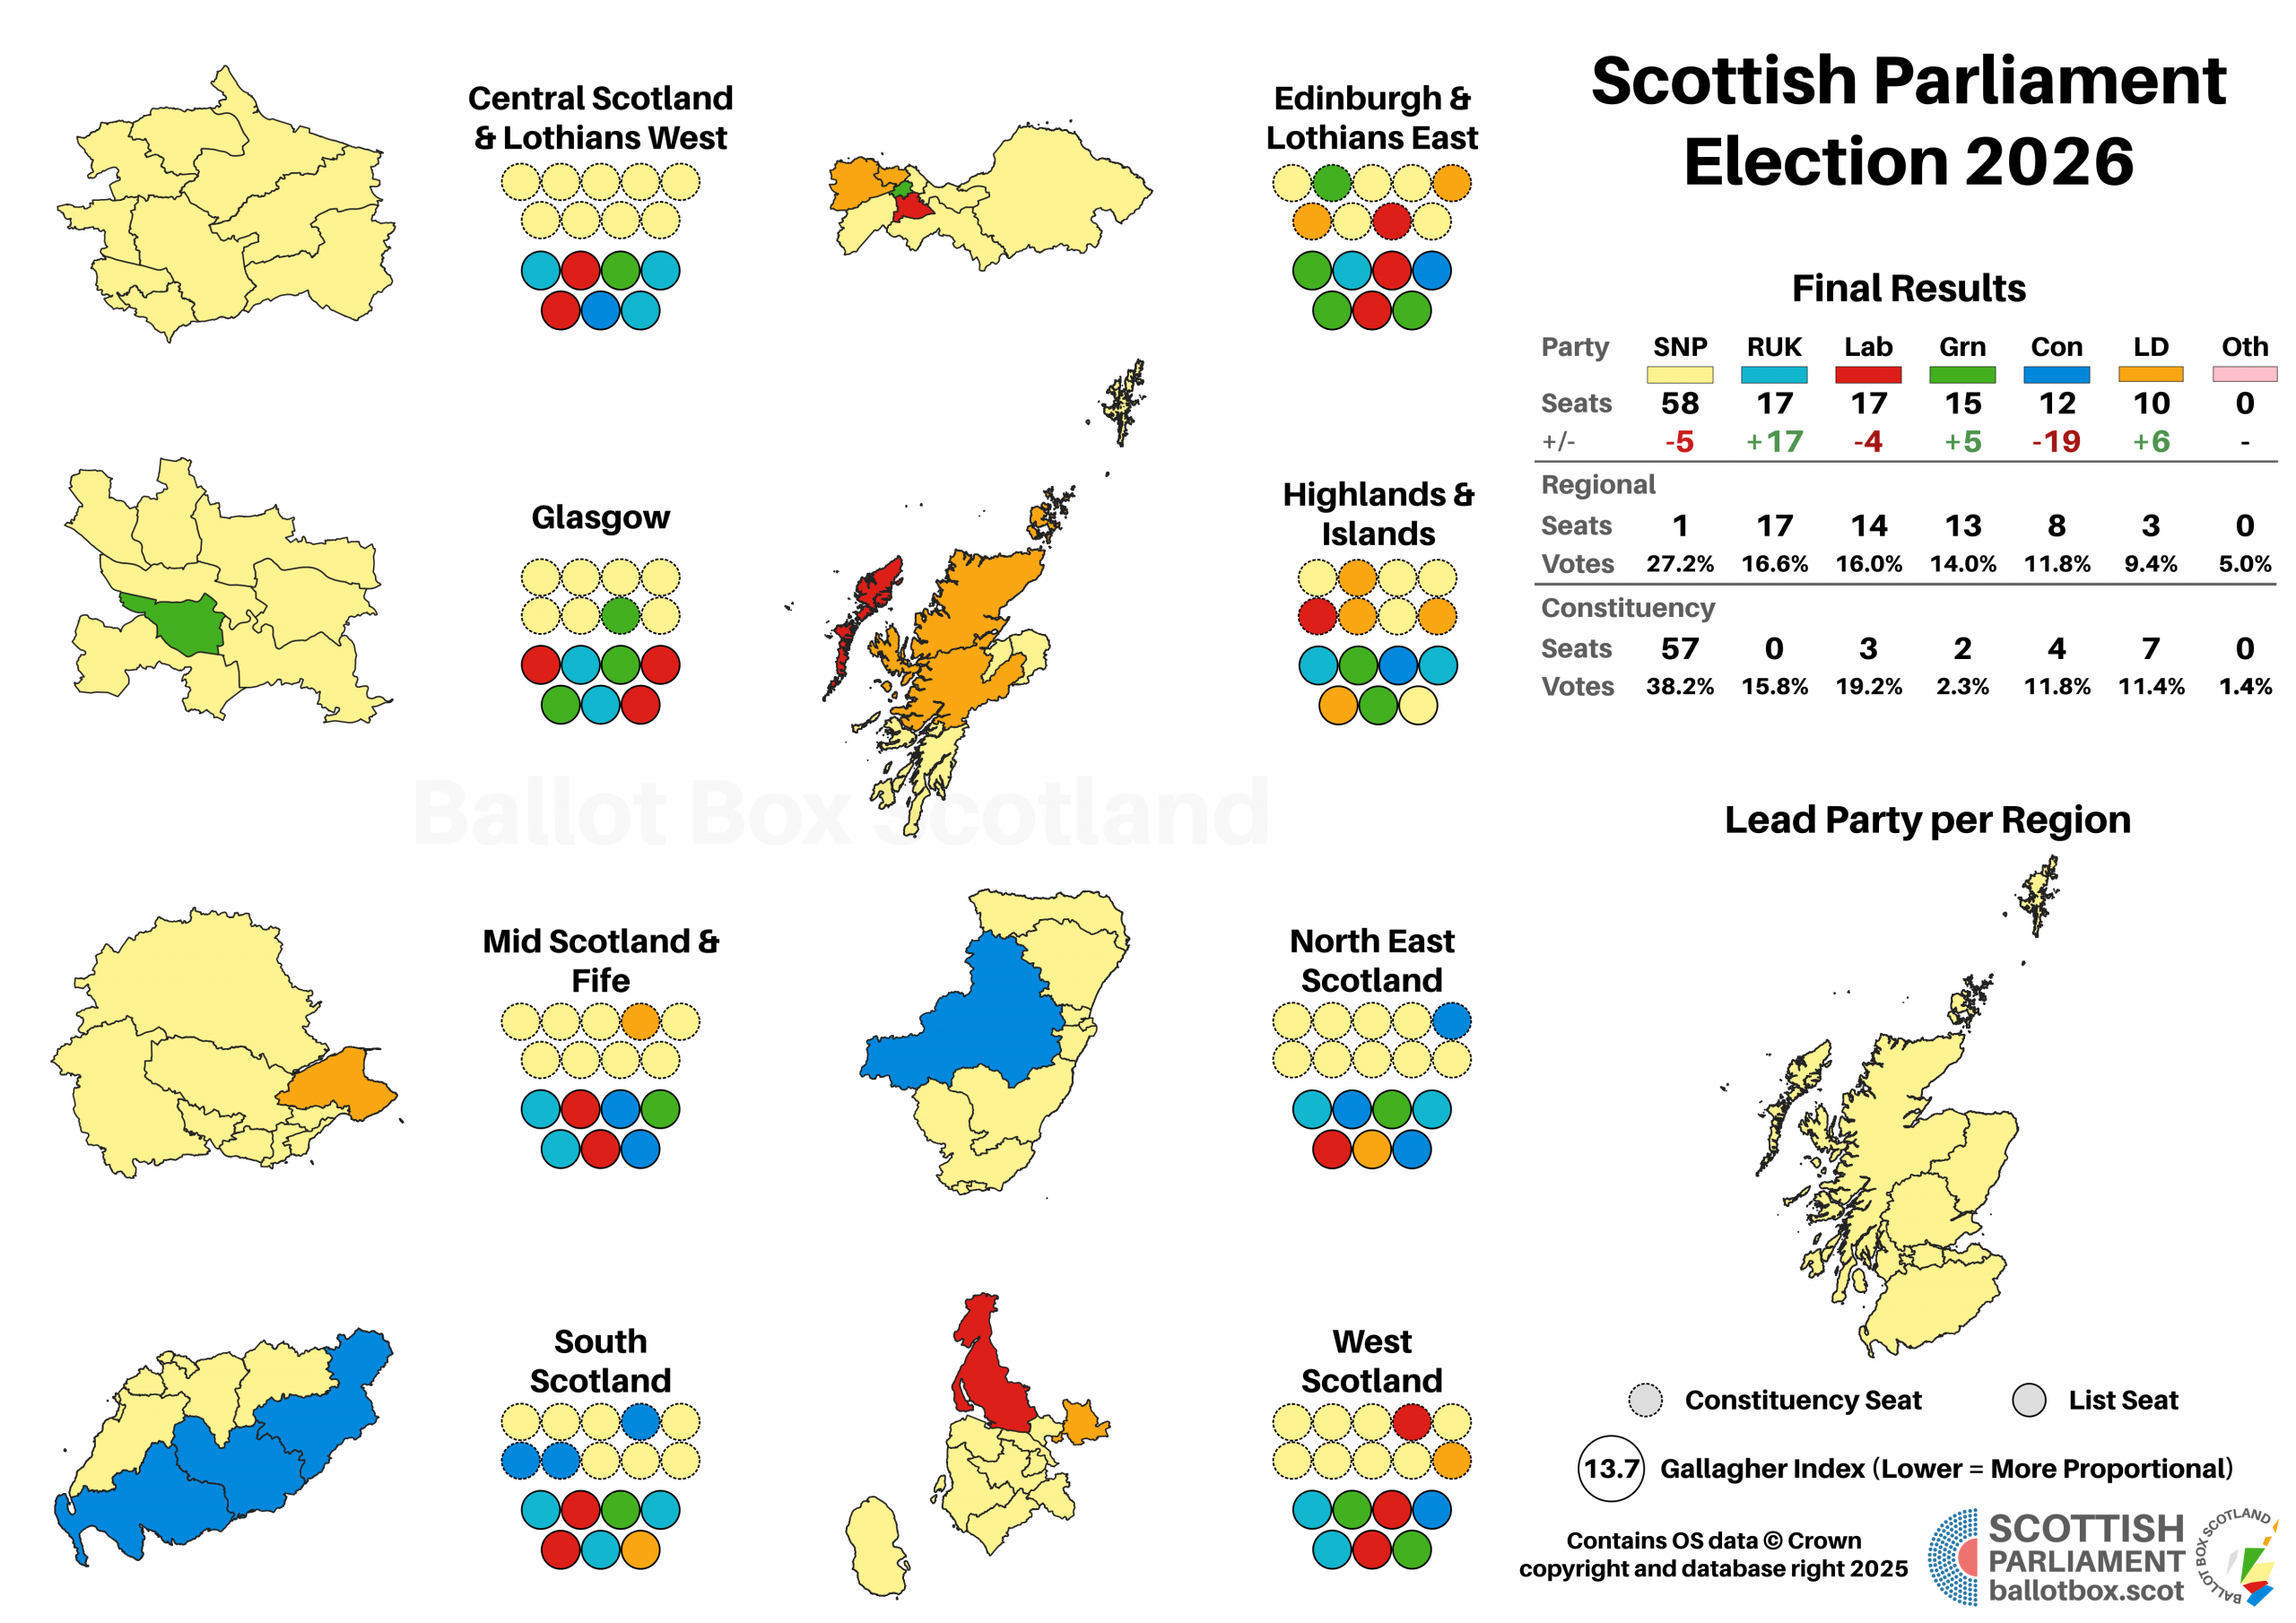
If you’re reading Ballot Box Scotland, you know what happened at the election, but just as a refresher, this is what happened at the election:
Ideal AMS Result: GI 4.9
Throughout the campaign, I consistently highlighted what the AMS ideal outcome was in projections. Unlike the thought experiments that follow, this is essential context for understanding the result. This is what the regional list vote was effectively aiming for and, barring the case of the Highlands and Islands, was not able to deliver. These figures are important to take on board because they remind us the SNP did not win so comprehensively because they remain highly popular, but instead because the FPTP element of the system insulated them from the loss of a third of their vote. I was banging this drum almost a year ahead of the election, as set out in this piece.
Seats per region (Actual)
Seats per region (Ideal)
We can immediately see how much better for proportionality this is by the fact the GI plummets to 4.9. That’s pretty low, indicating a strongly proportional outcome, which is due to the fact that for all its flaws the 15-17 seat regions used in AMS are significantly more proportional than you’d get from using STV in for example 3-5 seats like Ireland (or indeed 3-4 seats like Scottish councils). In total, the SNP ended up with 18 more MSPs than their AMS ideal: equivalent to the total excess across every election from 1999 to 2016!
Despite being better in pure seat terms for Labour than the actual outcome, there’s a degree to which this is substantially worse for them. Due to differences in how each party’s vote was distributed, Reform were blocked in a lot more seats (7) than Labour were (3). Had the system worked properly, Reform would be the unarguable largest opposition party. Even worse for Labour, the Greens had just the right distribution to do better than their vote share, and would have tied in seats, putting Sarwar in a weekly FMQ rotation not with Malcolm Offord but with Ross Greer and Gillian Mackay. With only 45 seats between the mainstream Pro-Union parties and 60 between the SNP and Greens, it’s very likely those FMQs would still be fielded by John Swinney.
There’s also a really niche little thing this highlights, which is how poorly some sections of the Scottish media understand the voting system and proportionality. With Reform’s rise, a narrative emerged that more parties competing for list seats would make it harder for others to pick up seats. I pointed out that this was only true insofar as Reform were competing for the same voters as those other parties. Indeed, a claim on the BBC that the Greens would be most impacted by Reform’s rise was therefore demonstrably untrue, as there are no two parties fishing in less similar voter pools.
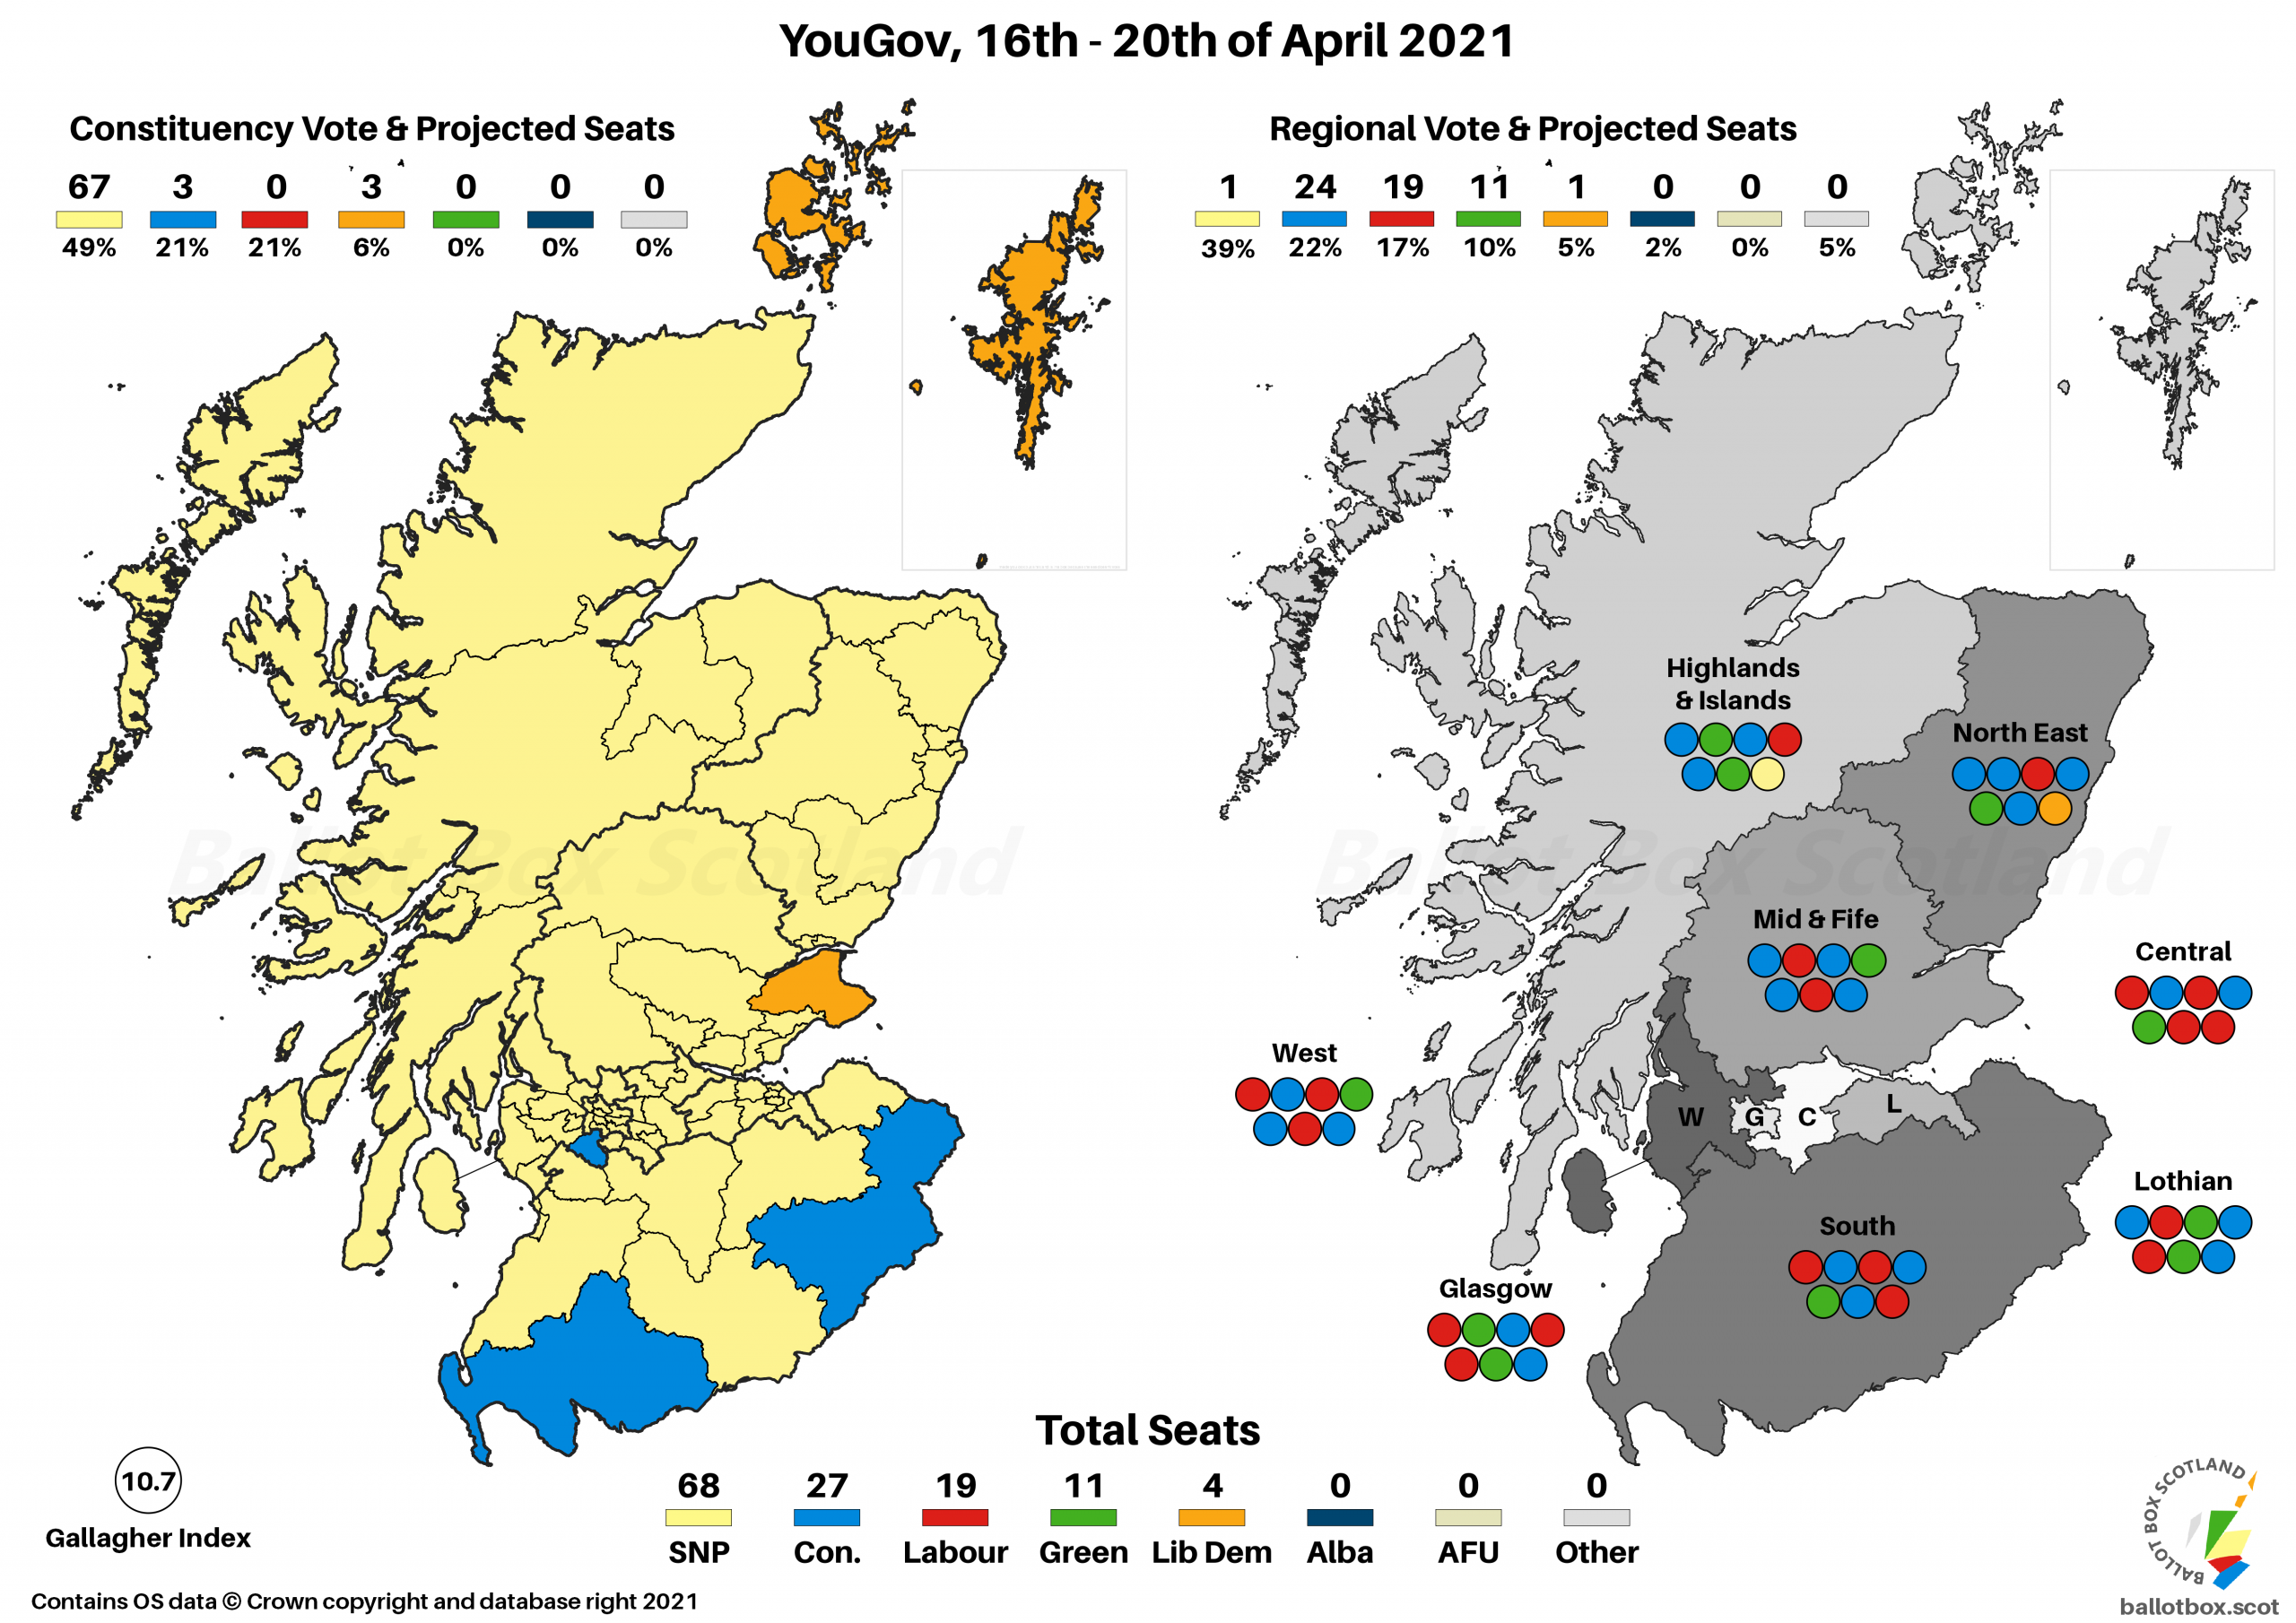
One thing I appear not to have mentioned is that in fact this could have had the opposite effect. If there are more viable parties standing in an only partly proportional system, the effective support needed to win a seat could actually decrease… at least, were the SNP not warping the proportionality! We can see that in these figures in that if you go back to the 2021 version of South Scotland (substantially different to the version that exists now), the Greens won 5.3% of the vote but did not get a seat. This election they were due two in South on 9.7% of the vote, or 4.85% per seat. How does that happen? Well, because there would have been more “wasted” votes between the Pro-Union parties that were slightly above what they needed for X number of MSPs in the region, but short of what they needed for X+1.
Sticking with 129 MSPs and AMS
Let’s start with relatively small changes: we keep the voting system effectively as-is, and we keep the total number of MSPs. All we do is change how we allocate the list MSPs within that framework.
Sainte-Laguë: GI 13.7
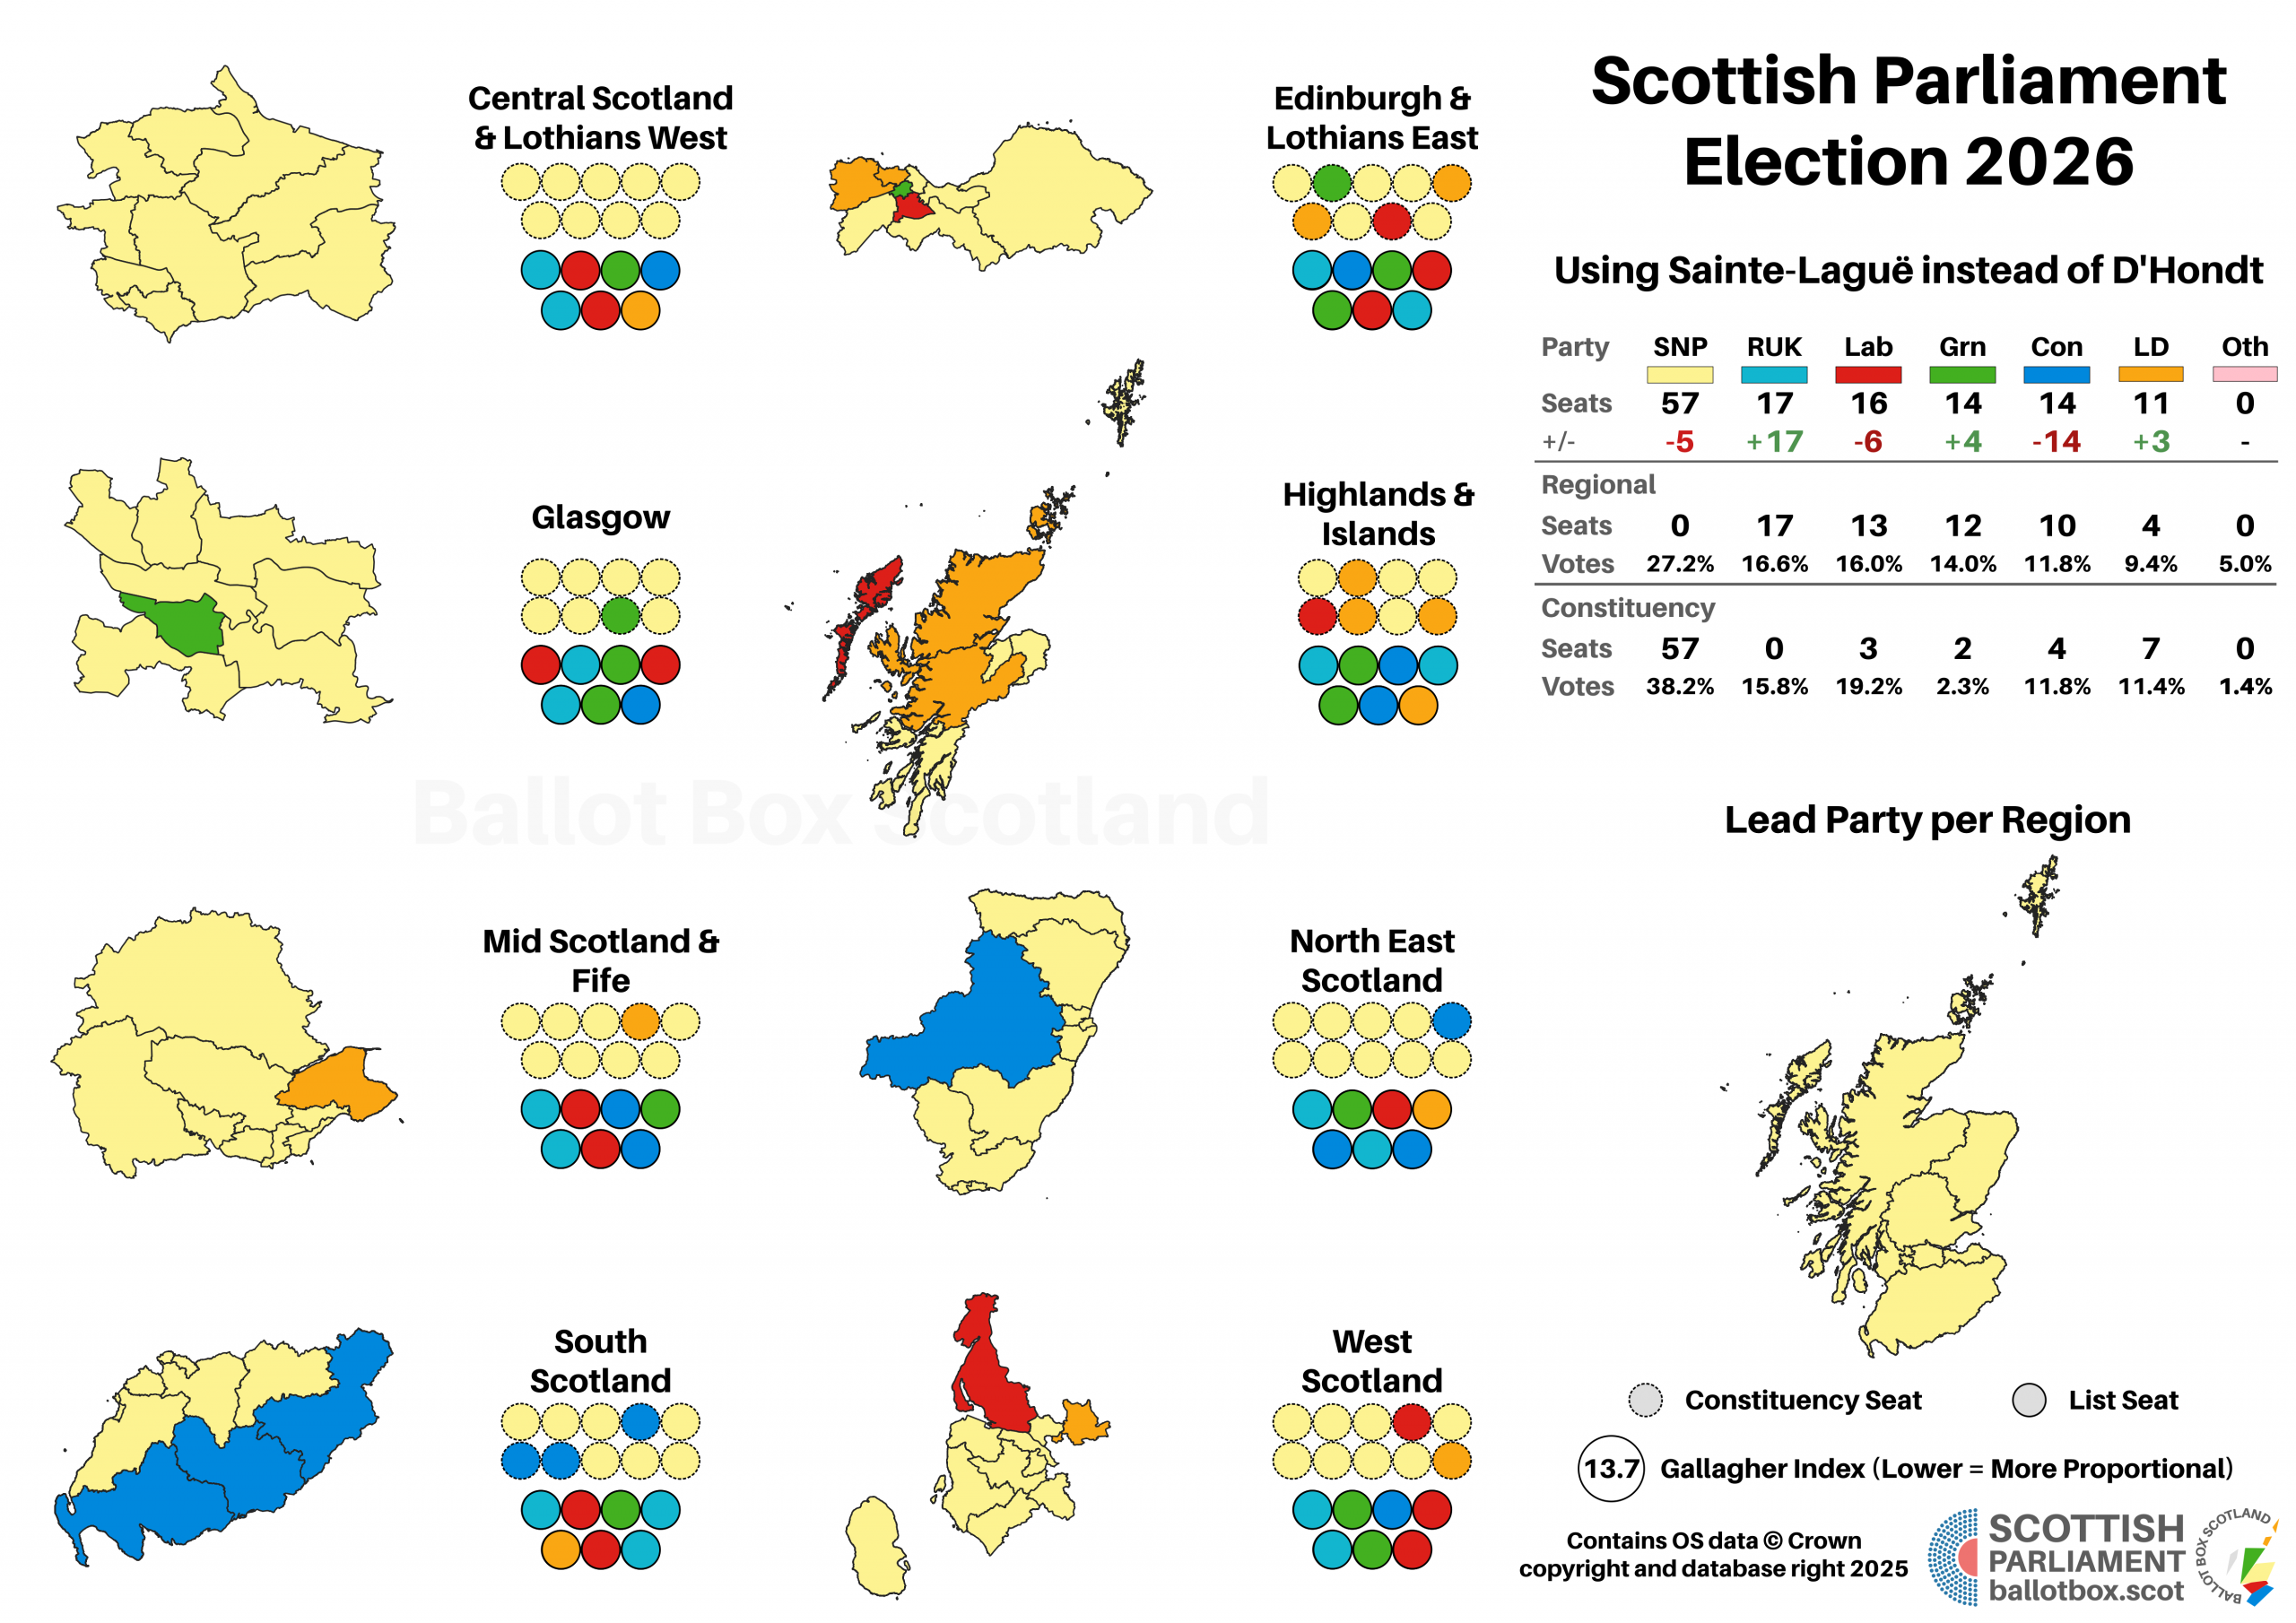
A very simple change we could make is to replace the D’Hondt mechanism (votes divided by seats +1) with Sainte-Laguë (votes divided by double seats +1). This tilts the system slightly towards smaller parties, as it makes it easier for them to pick up a single seat in a region. In 2021, this would have added a net total of 5 MSPs to the Green and Lib Dem benches.
This has a similar effect to the last election in that it boosts the representation of the two smallest parties… it’s just that now the Conservatives are one of them, instead of the Greens. That pairing gives us the clearest indication of the difference between the two mechanisms, as it equalises those two parties. It also adds a seat to the Lib Dems and takes one each from the SNP and Labour, which would have put Reform properly ahead of Labour. Collectively this does nothing to fix the disproportionality: it’s the same GI of 13.7, it just shuffles around who has taken the biggest hits.
Nationally Allocating List Seats: GI 13.1
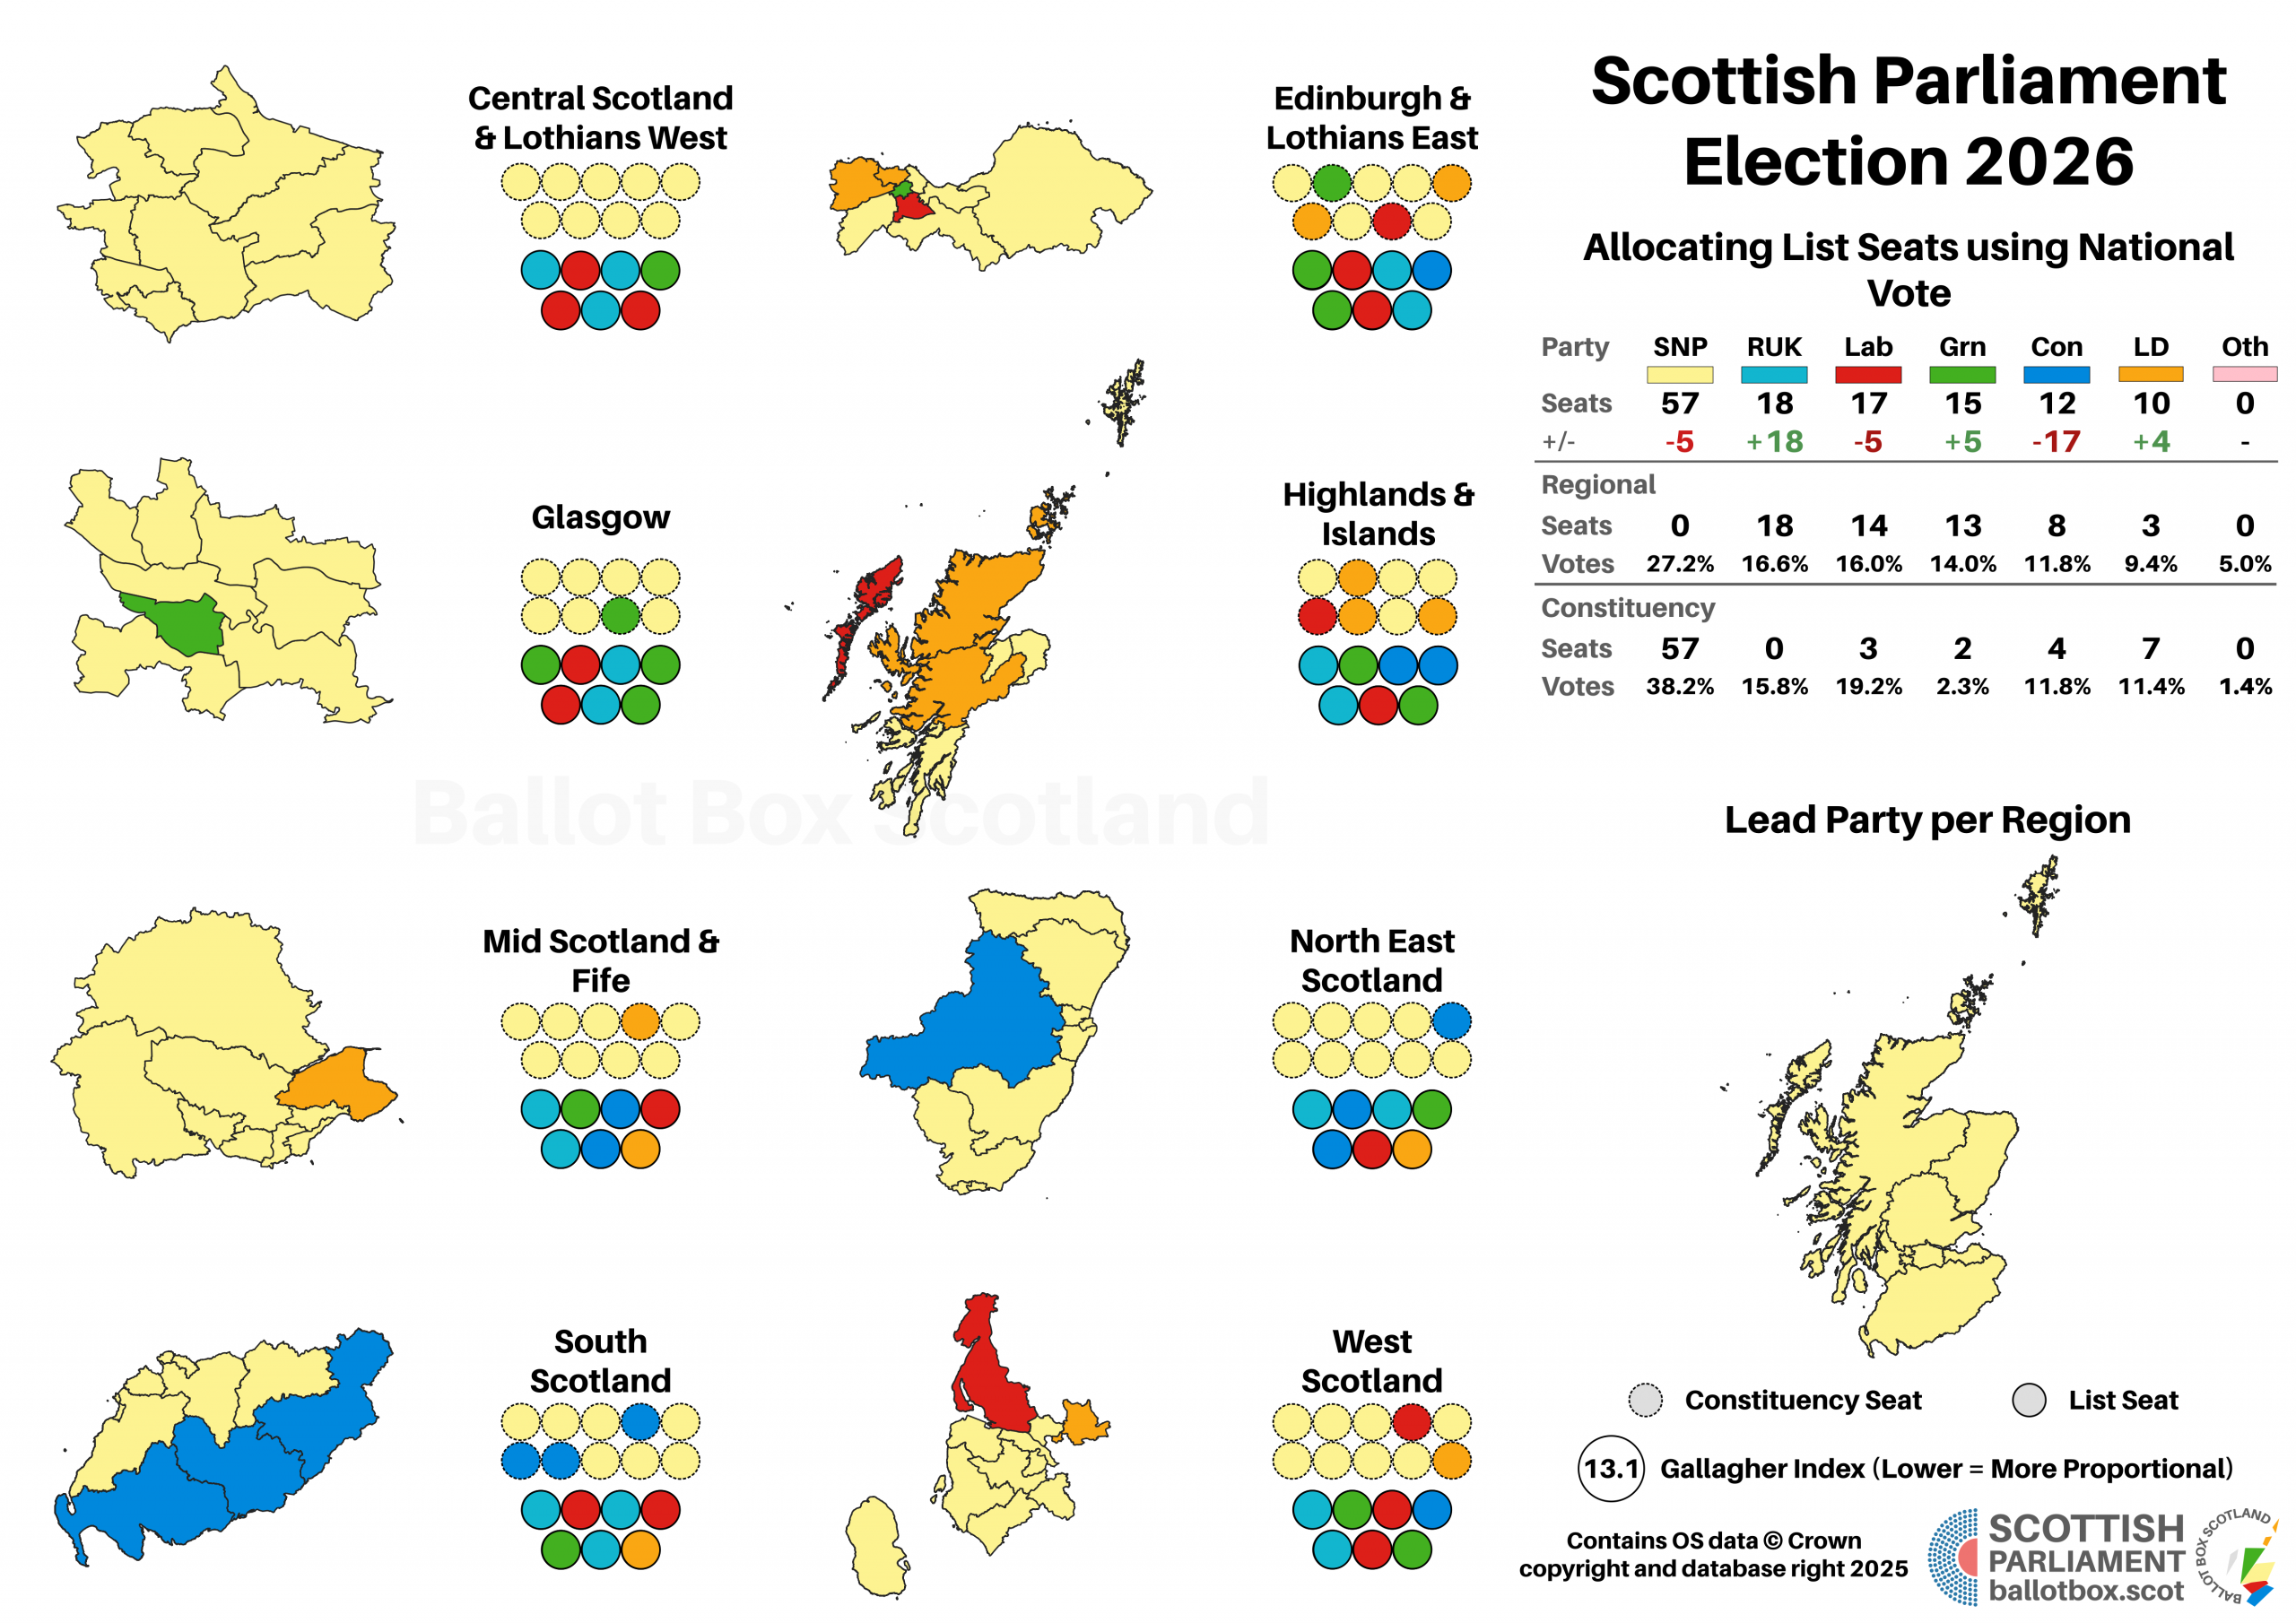
An alternative would be to use the national vote to allocate list seats. They still go to specific regions, effectively working on the basis that when it’s a given party’s turn for a seat, it goes where they were next closest to winning one. If we again look at 2021, this adds a total of 4 MSPs to the Green and Lib Dem benches as the parties most negatively impacted by the regionalised nature of proportionality.
This time it does almost nothing: the net total is one extra Reform MSP, so again putting them ahead of Labour, and one fewer SNP. This effectively emphasises how there isn’t really any such thing as a “small” party at Holyrood this term. Unlike 2021 where the Greens and Lib Dems were suffering from how their vote was distributed, this time their votes were spread well enough to give them the “right” tally when accounting for the SNP’s excess. Again though, the impacts on proportionality are very minimal, as the GI only goes down a tiny bit to 13.1.
Adding additional MSPs to AMS
We can go a step further and try and address disproportionality by adding additional MSPs. It’s worth noting that actually we should be doing this anyway, as Holyrood has accumulated a lot more powers than it had when it was established. Wales has just gone from 60 to 96 Senedd members in recognition of their even more substantial gain in powers since devolution began.
“More politicians” is never popular with the public but that doesn’t mean we shouldn’t do it. Holyrood clearly struggles now in terms of balancing Ministerial portfolios without making them over-large, in having enough backbenchers to sit on committees, and indeed on having enough committees that don’t have huge remits.
Add 2 MSPs Per Region: GI 10.1
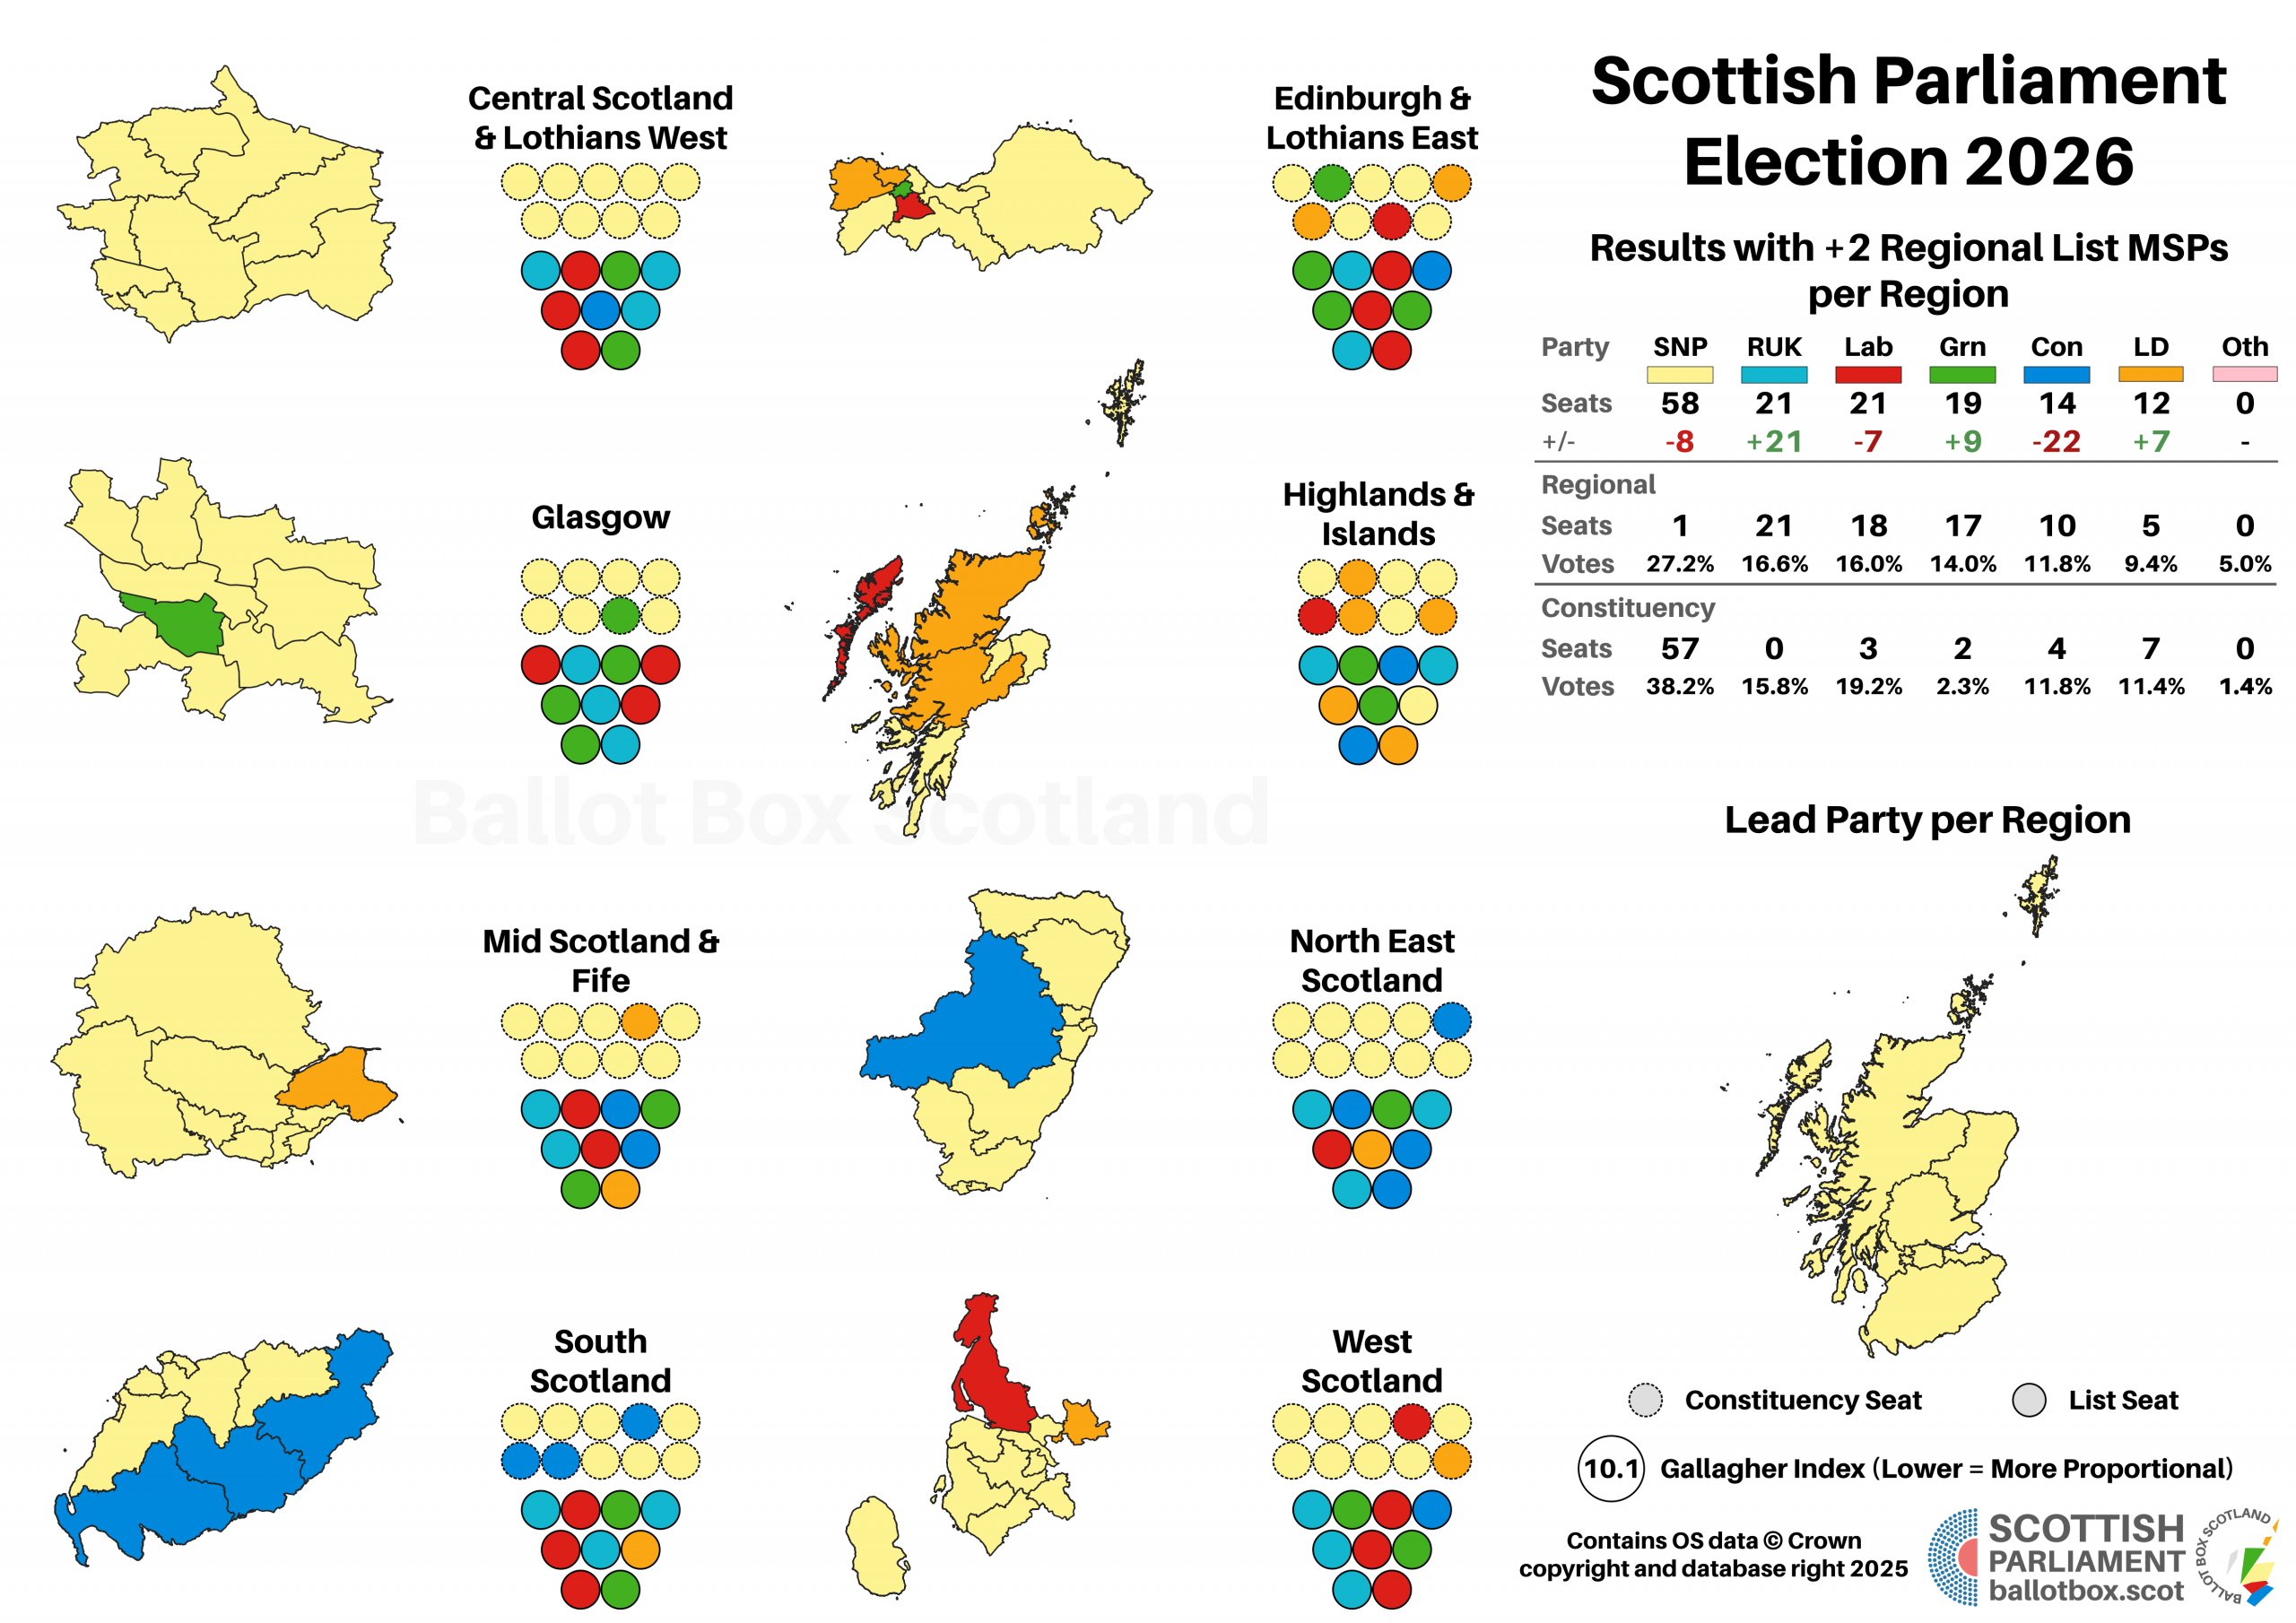
Given the points made in the intro to this section and how easy it is to do, this is the one reform I think we could actually get through Holyrood this term: simply add an extra two list MSPs to each region, giving a total of 145 MSPs. The reason for saying two is that would give 72 list MSPs, basically equal to the 73 constituency MSPs. Those extra 16 MSPs would help to ease both the pressures on capacity and proportionality.
Everyone bar the SNP comes out of this with at least a couple of extra MSPs, though this does nothing to unstick the tie for second place. It also leaves the Pro-Independence majority intact despite the lack of votes for such an outcome, which speaks to the scale of the SNP’s over-representation in the constituencies.
Simple Overhang Correction: GI 9.8
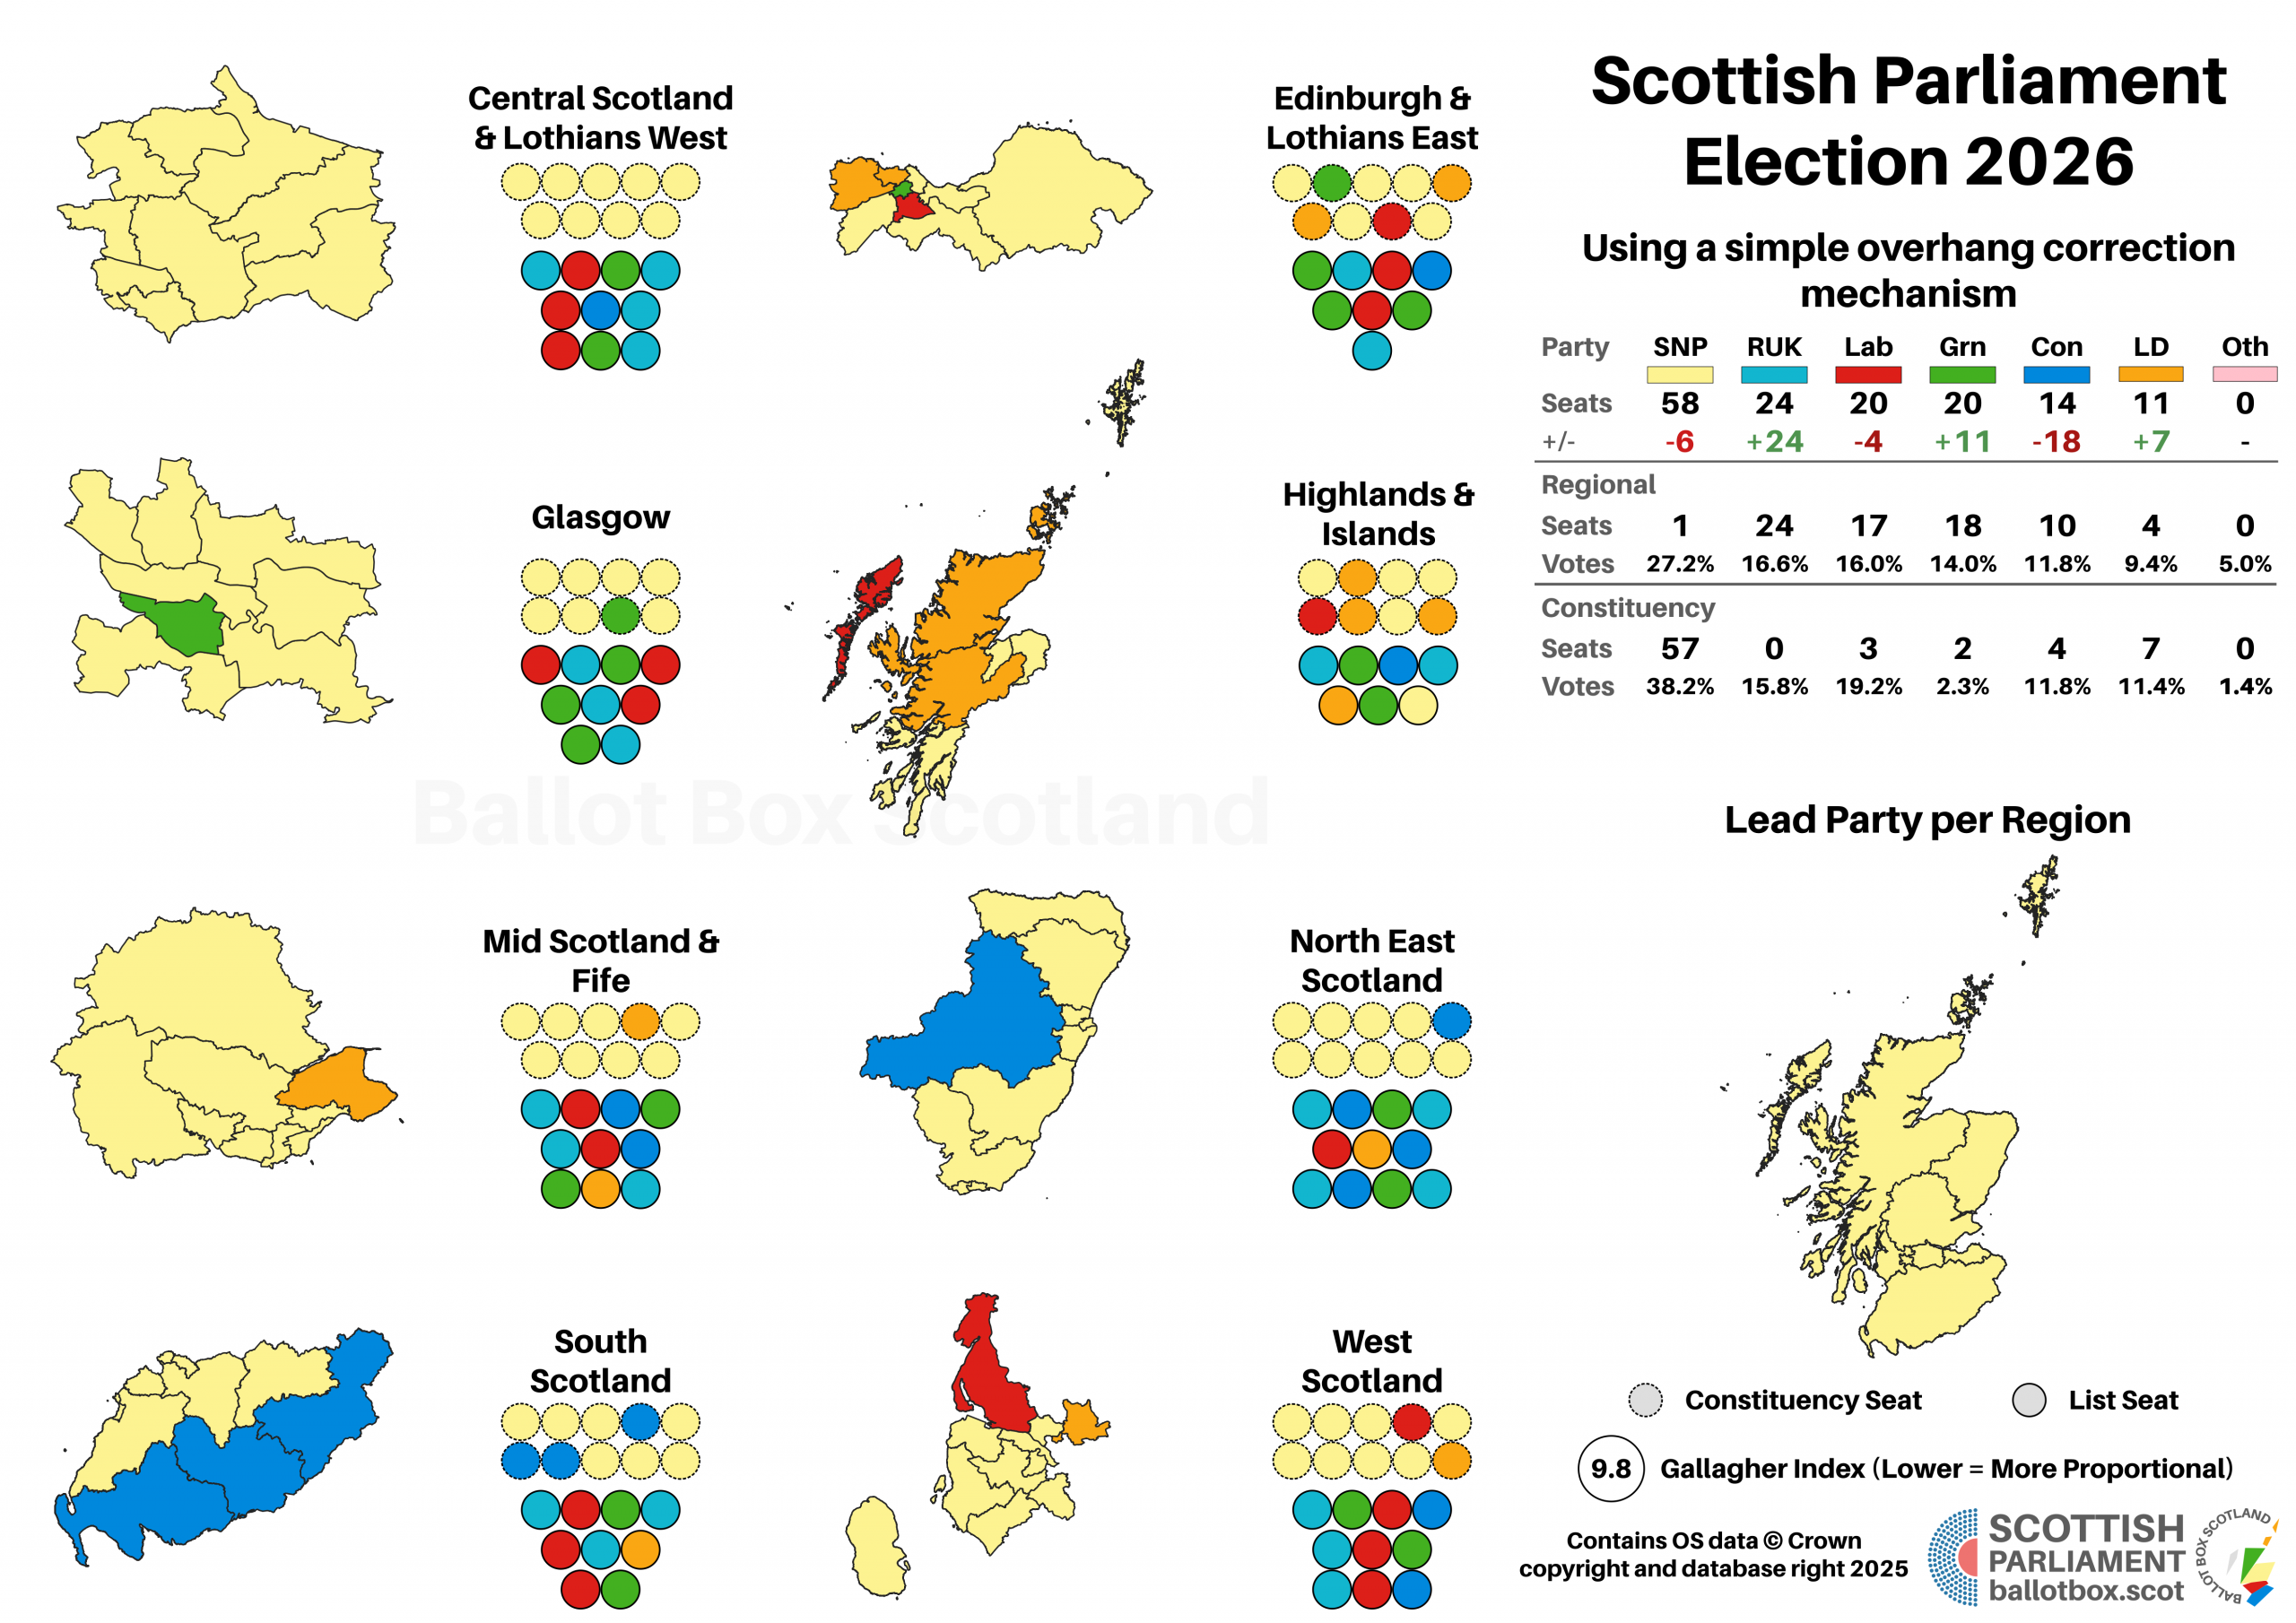
We could also expand parliament on a more ad hoc basis, partly following the example of New Zealand. There, if a party wins more constituencies than it should have, it gets to keep them, but it doesn’t stop other parties from winning list seats they are due. To replicate that, we can just give all the non-SNP parties their ideal AMS share as extra seats.
Since the SNP won 18 seats excess, this simply adds 18 seats to the other parties. That’s coincidentally very close to the +2 MSPs per region arrangement, just distributed differently and since it corrects actual disproportionality, it’s the first model that has an FPTP element to just squeak the GI figure into single digits at 9.8.
Full Overhang Correction: GI 4.8
Something I didn’t map but when I thought about it decided to calculate out of interest is what if it was full correction, in the style Germany used to do? This goes beyond just compensating for otherwise lost seats and goes, “hang on, the party with too many constituencies still has an exaggerated share proportionally: let’s hand out even more list seats to fix it!” As with the simple correction, this is based on regional rather than national proportionality.
The way I did this was allocate seats using the regional vote until it hit the actual number of seats the SNP won in each. This adds extra 36 MSPs above and beyond the 18 already added by the simple correction, for 54 additional seats in total. By contrast, full correction in 2021 would only have added an extra 2 MSPs above the 4 from the simple correction.
Needless to say, Holyrood simply is not set up to be expanded by 42% because one party absolutely wrecked the proportionality at constituency level. Given it’s also pretty unacceptable in my view to allow that proportionality wrecking to happen, the best option is simply to not use an FPTP element.
Reformed AMS: GI 9.5
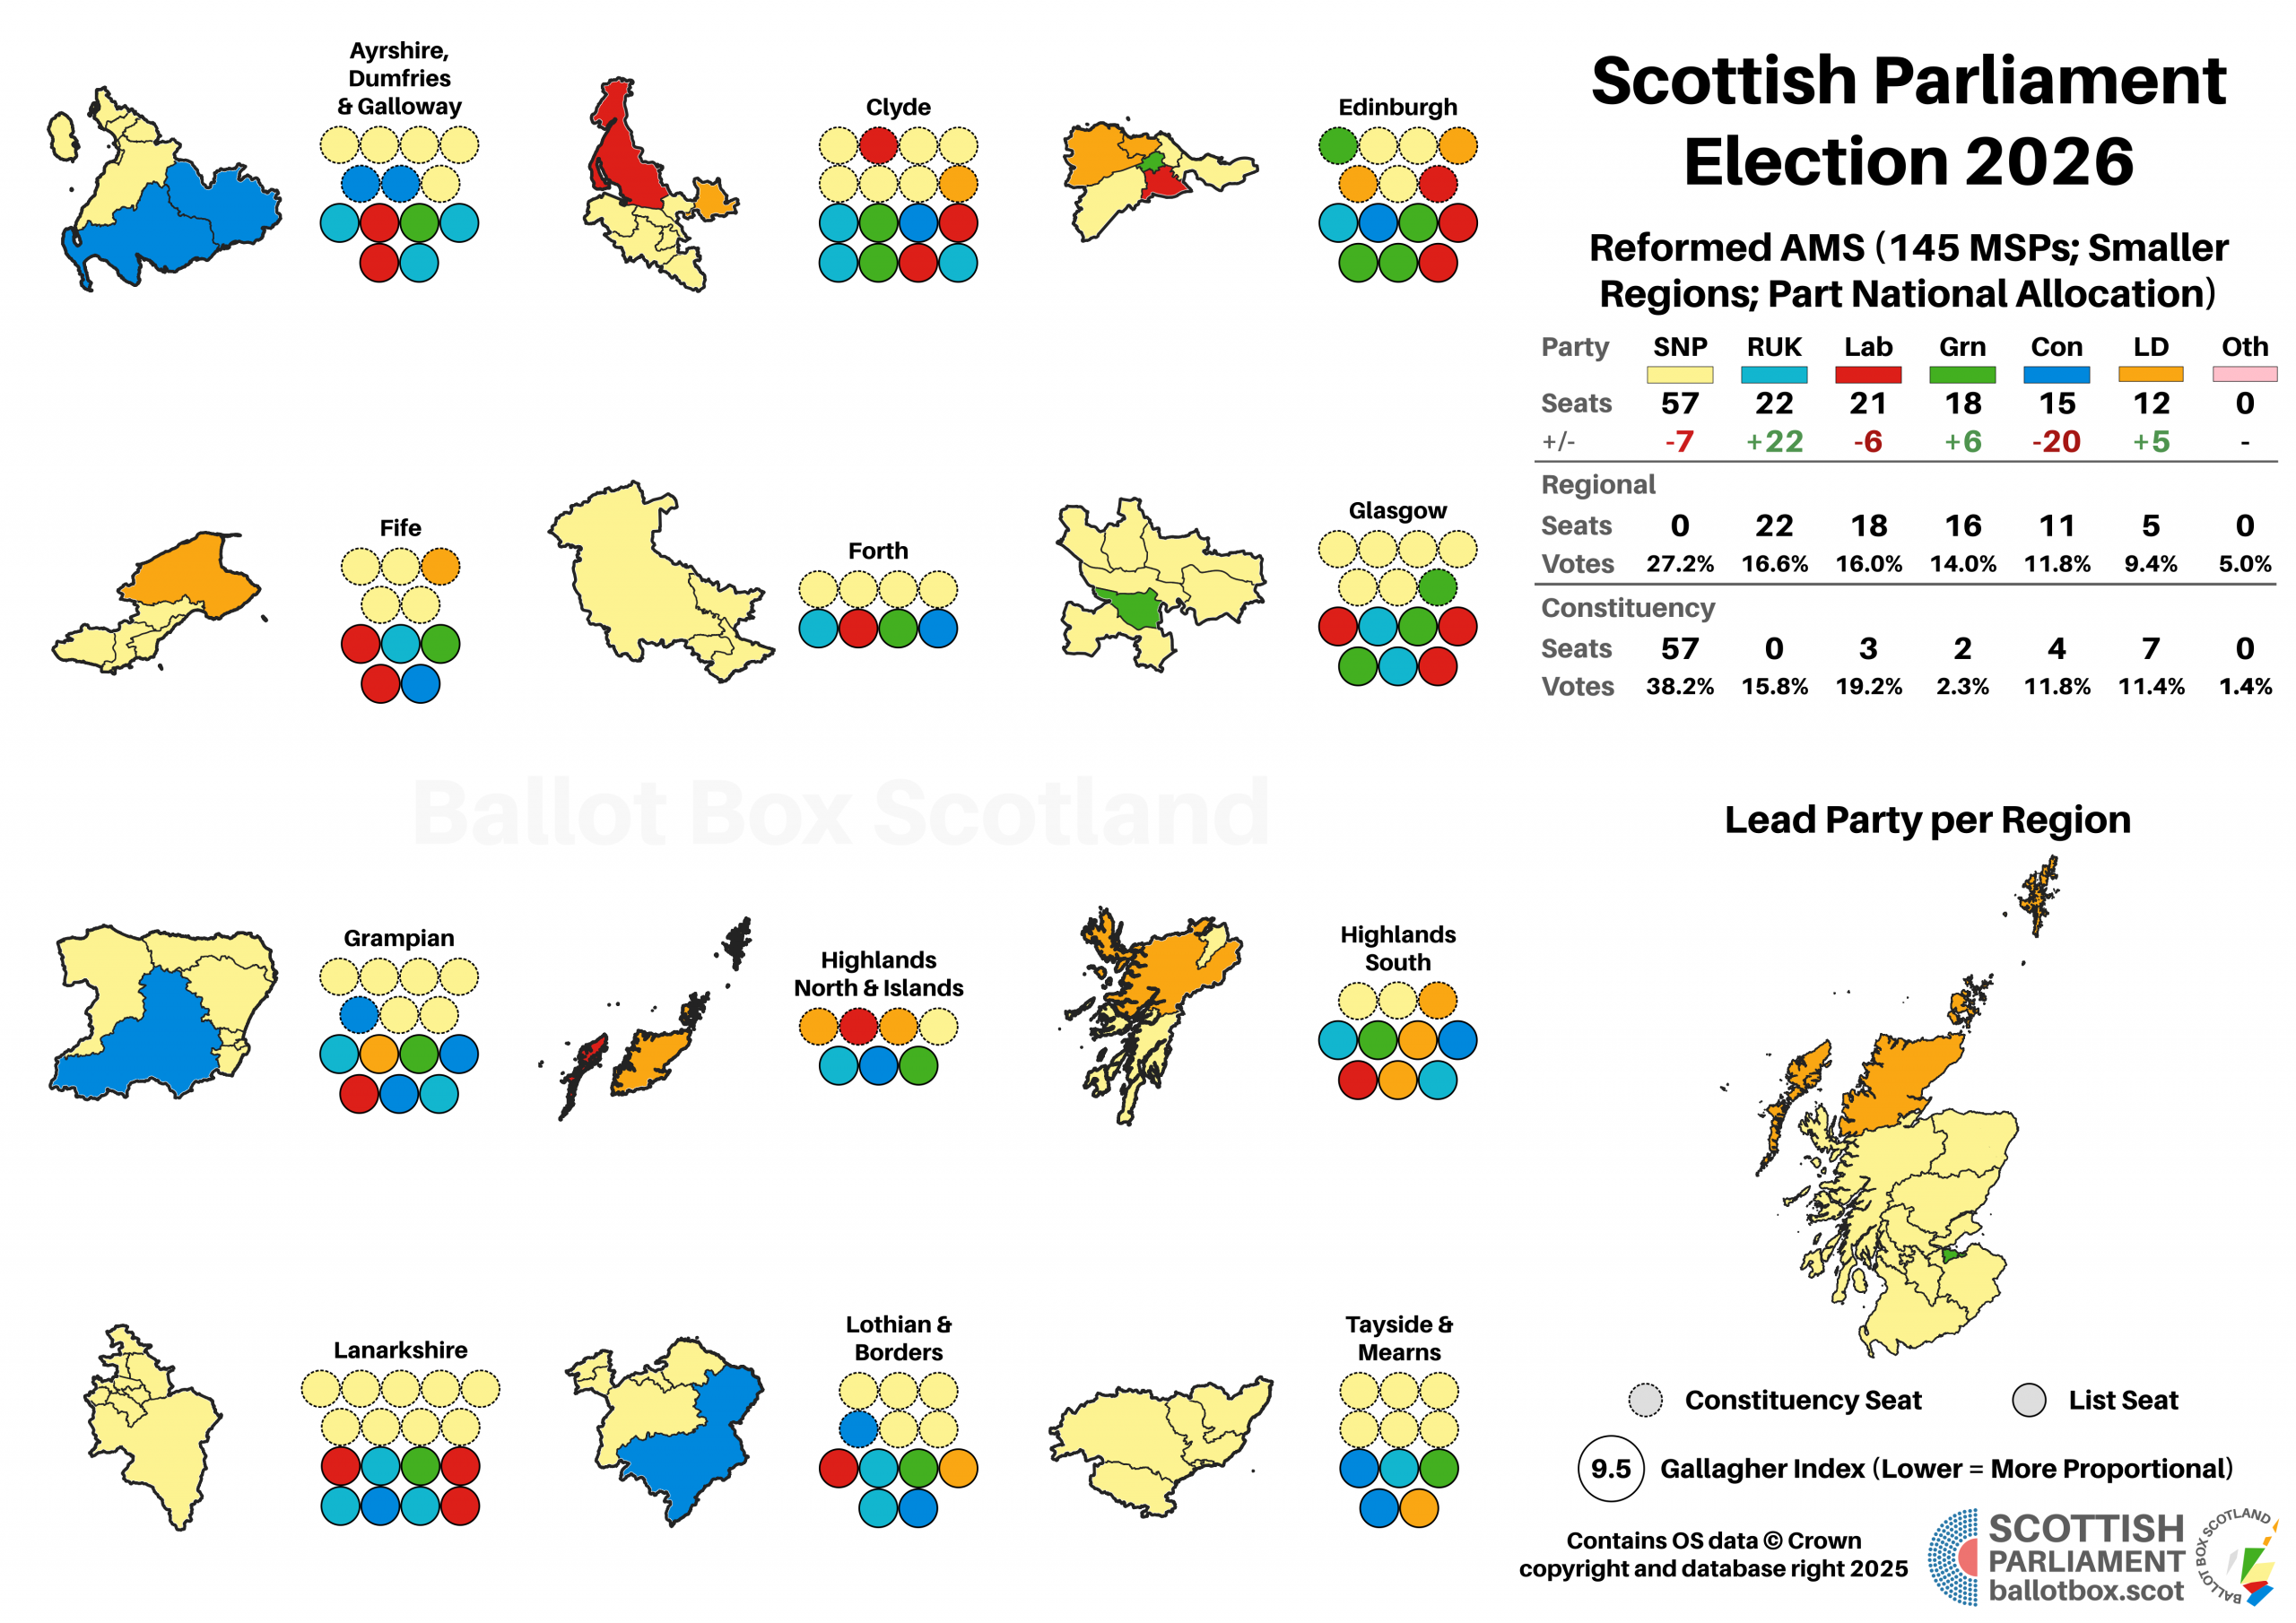
If we’re adding MSPs to Holyrood though, that’s also a great opportunity to re-think how we allocate list MSPs and whether we really need to aim for roughly equally sized regions. We could instead reformulate AMS slightly so that it uses more (but still not perfectly) natural regions, and distribute list seats in different proportions to each of those. Then, we can hold back a small proportion of these to be allocated based on the national vote.
This does create some visual oddities. For example, since I am “protecting” the two regions I split the Highlands and Islands into by preserving a higher number of MSPs than their population would otherwise call for, the Highlands South region ends up with more than twice as many list MSPs as it has constituncy representatives! That kind of thing is an advantage to this system rather than a flaw, as it allows for you to give parts of the country more voice in the parliament without actually giving their votes more partisan weight in determining the outcome.
The additional pool of MSPs plus an element of national allocation gives us the best GI of anything without full compensation or pure proportionality yet, at 9.5. That is still much worse than 2021 though
Ditching AMS entirely
Finally, we could just get rid of AMS altogether. By this I obviously don’t mean “go to pure FPTP”: that is undemocratic and one of my reddest lines and hottest takes is you cannot support FPTP in 2026 and call yourself a democrat. It’s incompatible with genuine democracy, even if the UK as a democratic polity has ended up stuck with it through a combination of inertia and the self-serving refusal of the two big parties to replace it. Instead, I mean get rid of the FPTP element entirely and use a purely proportional system.
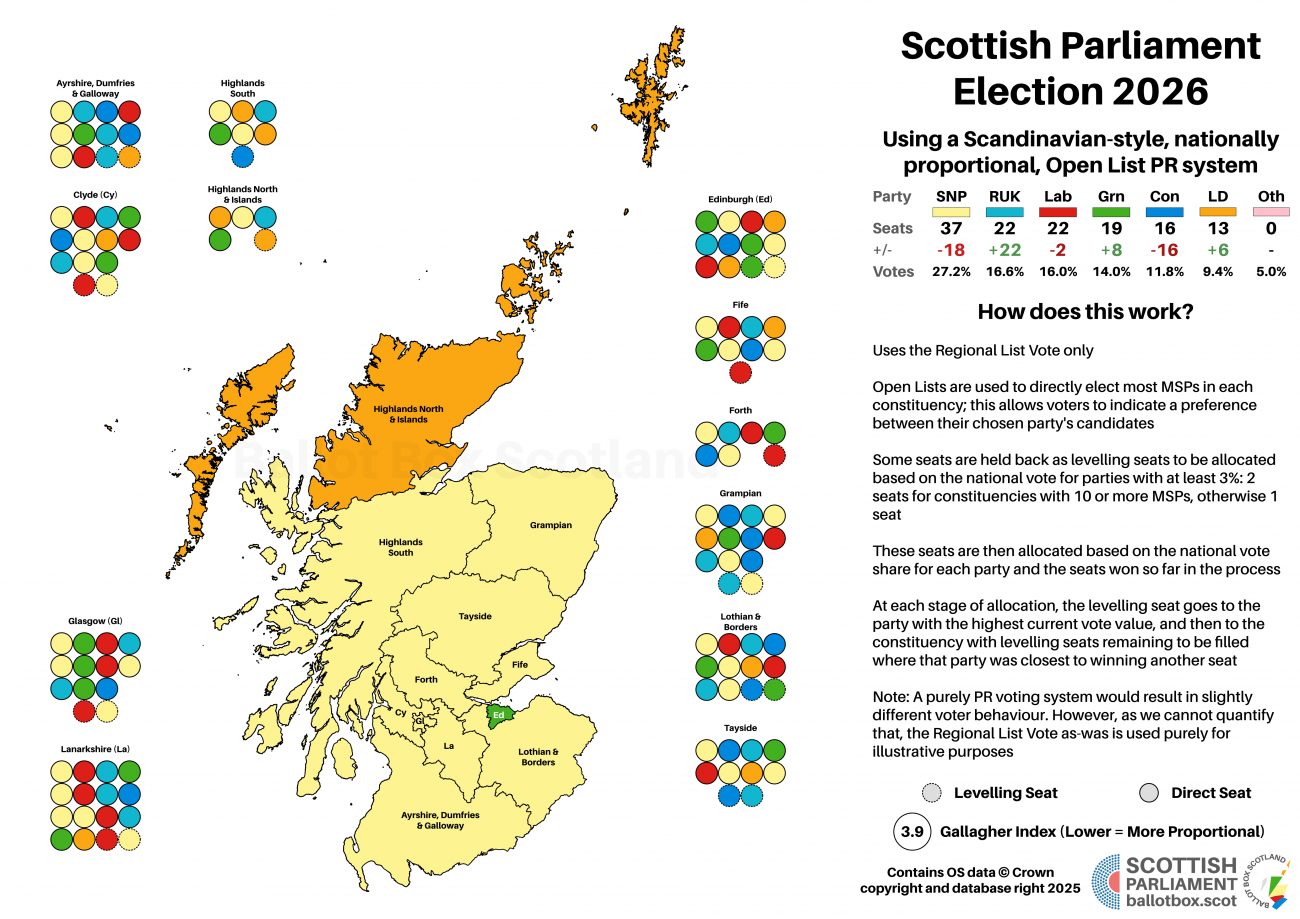
Scandi-Style: GI 3.9

This would be a complete replacement of the entire system, replacing it with a Scandinavian-style electoral system. These systems are purely proportional and hold back a small portion of seats to allocate on the basis of the national vote. I wrote about this in much more detail years ago, though this piece will of course be outdated as it relates to the previous election. The principle behind this is very simple: we should aim for a system that is as proportional as reasonably possible, “reasonably” here being that you need to be either local popular enough to win a seat in a specific area, or get at least 3% of the vote nationwide to be allocated levelling seats.
It means getting rid of FPTP entirely, thereby removing the possibility that the inclusion of a disproportionate system can throw off the result and rob voters of representation they are fairly due. Not having to create roughly equally sized single member constituencies also allows us to follow much more natural boundaries. For example, as a Glaswegian I have been banging on and on about how ridiculous it is that Cardonald, which is part of the city council, is now part of the West Scotland region rather than Glasgow. Similarly, Rutherglen and Cambuslang shouldn’t be in the region. Freed from the constraints of FPTP Glasgow, nothing more and nothing less, can be its own electoral area.
As you can see, this creates a near-perfect match between each party’s share of the vote and seats. This has the lowest GI of any of the models in this piece, even lower than the AMS ideal, because the levelling seats counter the small disproportionalities that would otherwise arise between regions. This would however have created an admittedly challenging parliament this year.
Rather than a substantial Pro-Independence majority, the SNP and Greens combined would only have 56 seats. That would not automatically entail a Pro-Union government however, as Reform and Labour remain tied, and after much needling on the matter, by the end of the campaign Anas Sarwar said he would not work with Reform. With just 51 seats between the mainstream Pro-Union parties, someone would have to cross the divide: either the Greens to oppose the SNP (vanishingly unlikely) or the Lib Dems to support them (not the happiest outcome for them).
Crucially though, that working together is what the Scottish electorate effectively voted for. It may not have done so in explicit terms, but the fact barely more than a quarter of people gave their unqualified, proportional vote support to the SNP should mean accepting both the legitimacy of the SNP’s lead but also the need to work together. With Reform such a huge bloc at Holyrood regardless, our politicians are going to have to get over their ridiculous Westminster-brained culture of non-cooperation at some point regardless.
Scandi-Style for 145 MSPs: GI 3.9
In retrospect, given I believe that increasing to 145 MSPs is a viable and desirable outcome regardless of system, I should have done a fully worked-through version of this system for that total. At this point I’m knackered so won’t be mapping it, but working out the numbers is easy enough:
Labour really hypothetically lucked out on this one again: they got seat 140 and 145, whilst Reform got seat 141, meaning that despite Reform’s slight lead in votes, Labour would again equalise rather than slip behind. Just 211 extra Reform votes nationwide would have opened up a two seat advantage at seat 145 instead! PR can be exciting and nail-biting too everyone!
All in One
To wrap up, let’s put all of this into a single chart, so you can see directly how each system compares:
There’s a very simple message from this: it doesn’t matter how much you play with the number of list seats or how they are allocated. Unless you go the full pre-2025 Germany and restore proportionality via a massive inflation in the size of parliament, this year the SNP simply won too many constituency seats. Only by removing FPTP from the equation entirely do you get a properly proportional result that doesn’t require extreme correction to get there.
As ever, I appeal to people to put their own partisan preferences aside: if you feel you’ve benefitted from this, remember the cautionary tale of Scottish Labour. They felt FPTP and FPTP-inclusive systems would keep them dominant forever. Instead, they contributed to two wipeout elections at Westminster and have helped consign them to a constantly weakening opposition for 15 years at Holyrood. Yet in 2024, they surged back at Westminster to absolutely eviscerate SNP representation.
Setting up systems in a way you think will benefit you is simply too risk. At some point, your opponents will overcome your cleverly rigged system and you’ll find that it suddenly works just as well for ruining you as it used to wreck them. Whilst I’m not saying only my maximally proportional Scandinavian-style system is the only fair or legitimate system, I am saying that if you set up a system to work towards very high proportionality, no one gets unfairly inflated or deflated by it, and the focus of elections can be entirely on winning votes in your own right rather than to try and stop someone else.
If you find this or other Ballot Box Scotland output useful and/or interesting, and you can afford to do so, please consider donating to support my work. I love doing this, but it’s a one-man project and takes a lot of time and effort. All donations, no matter how small, are greatly appreciated and extremely helpful. (About Donations)