

As if we didn’t have enough political excitement this week with the local elections TOMORROW, we’ve got a new poll out from the usual partnership of the Scotsman and Savanta ComRes. In a departure from the norm, I’m just publishing this straight up without seeing the tables (or waiting three working days for them), just because I simply would not have the time right after the election to do so. “Current election results” naturally take precedence over “hypothetical polling”.
The previous ComRes covered the 10th to 16th of March. Changes are shown as (vs that poll / vs last election).
Regional Vote
Starting with the regional vote, this poll is entirely made up of highest or lowest shares of the term. On the lowest side of the scales, these are weak results for the SNP and Conservatives. This should be most concerning to the latter, but given my theory that the SNP’s local vote tends to look more like their list vote, they might be sweating about their prospects tomorrow too. Emphasis, by the way, on “more like” – I’m not saying it will be 31% for the SNP, just closer to that than to the high 40’s constituency figure.
For highest shares, it’s a joint top figure for Labour, the Greens (tied with their highest polling ever, also from ComRes recently) and Alba. The latter might want to hold off on their celebrations for now, as that’s margin of error movement, and given the 9% cratering of the SNP, doesn’t clearly evidence genuine growth. The Lib Dems meanwhile are on their absolute best share of the term thus far, the first time they’ve hit double digits.
Constituency Vote
Much less exciting over on the constituency side of things – no movement either for the SNP or Lib Dems, who are on middling shares by their standards. Labour are on another joint-best share, which gives them their widest lead yet over the Conservatives, who are again on their worst. That makes this the worst poll of the term for the Conservatives.
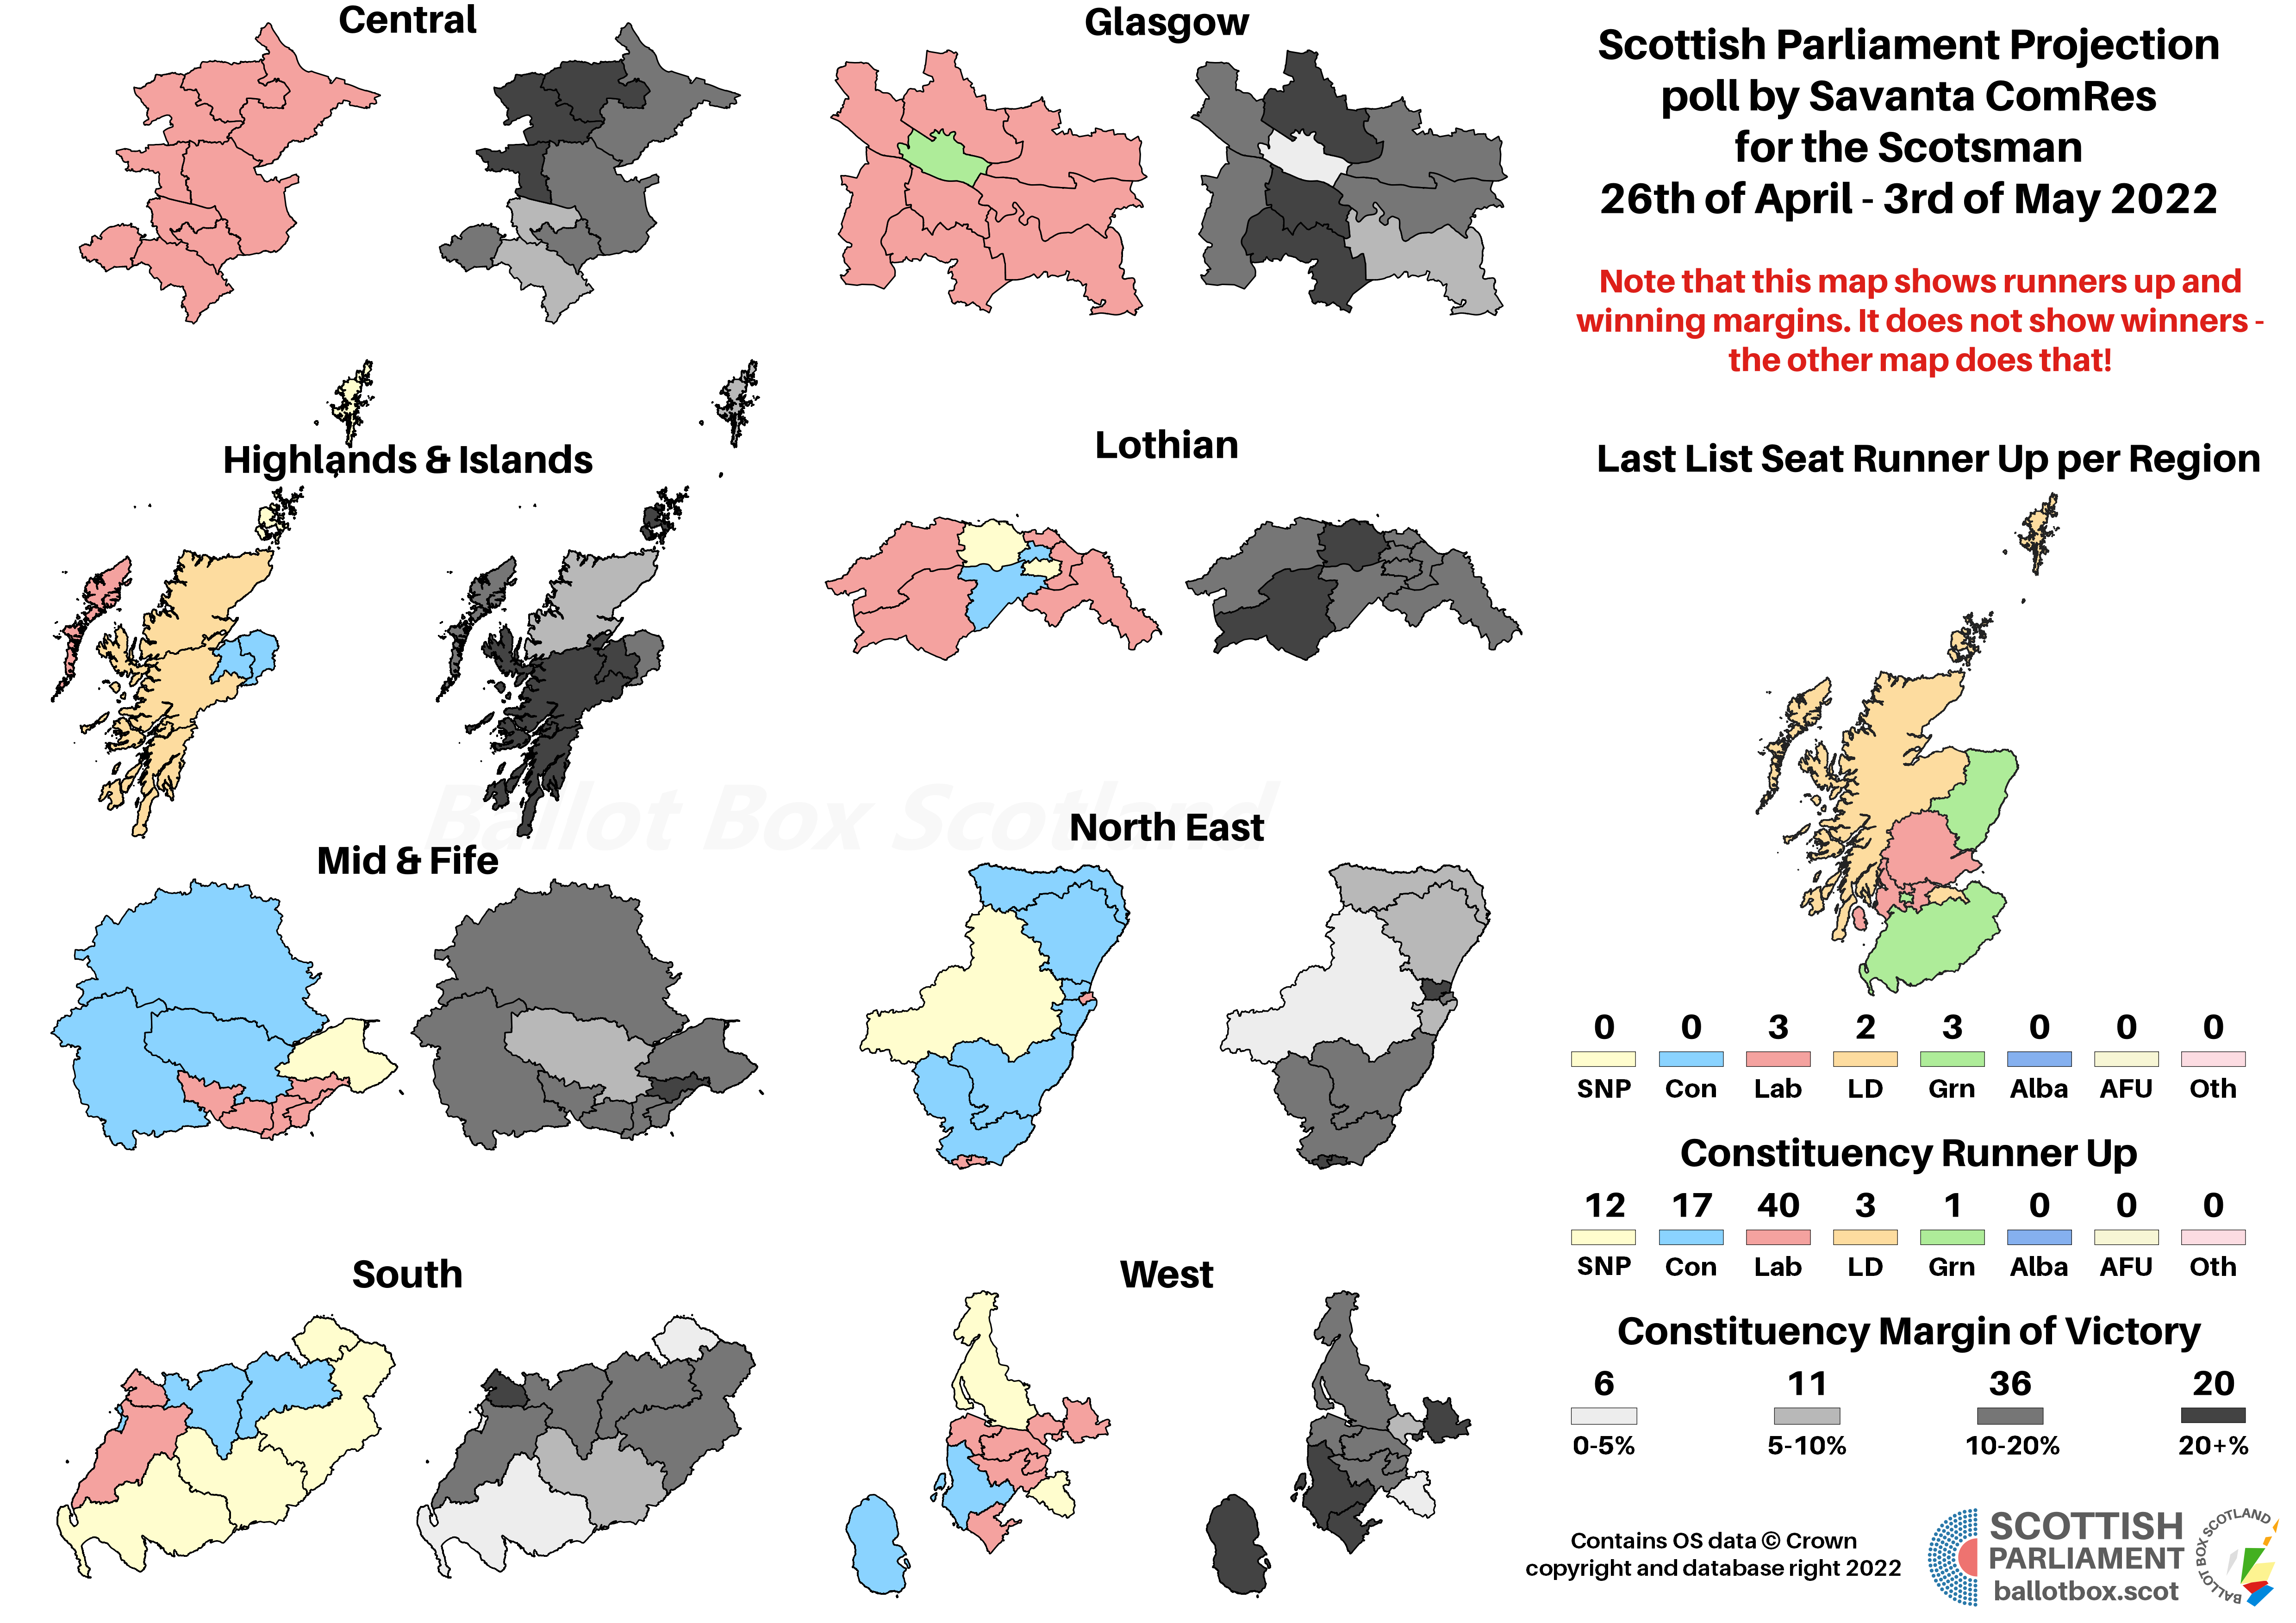
Seat Projection
Projecting that into seats might give us something like this:
Please see this page for how projections work and important caveats.

As sharp as their list vote drop may be, the SNP still emerge as by far the largest party, thanks to their constituency dominance. The Greens and Lib Dems would be up massively compared to last year’s election, whilst this confirms the “worst poll of the term” status for the Conservatives. Notably it’s not the best seat share of the term for the Lib Dems, because of overhang.
At this point, the overhang is going absolutely wild. A Gallagher Index of 12.6 (remember, smaller is more proportional) is pretty ridiculous for a proportional voting system. My experience now is that this gap between the SNP’s constituency and list votes does get often comedically large between Holyrood elections, then narrows again at the actual vote, but it’s still a suboptimal distortion of proportionality. A reminder that any use of FPTP within a voting system is, I’m sorry to say, just not good.
As usual, no Westminster voting intention from ComRes.
What’s that? Not much movement on the constitutional question? The same thing I’ve been saying for months? Welp, who’d have guessed. Very marginal movement in favour of Independence here, but still a narrow lead for the Union. Usual spiel here about how neither side should be complacent and it’s weird that some of their supporters think they have it in the bag, you know the drill.
Compared to the previous poll, a shift overall towards the longer timescales – 48% for in the next 10 years or longer, versus 47% saying within the next five. Within those blocs, the group saying they’d prefer one in the next year has seemingly grown, whilst the next two years has shrunk – perhaps, contrary to past experience, voters are indeed keeping up with their own statements on the passage of time!
Hypotheticals
As ever, the last little bit of analysis concerns those hypothetical and more proportional voting systems that I have a bee in my bonnet about here at BBS. The fact Westminster uses pure FPTP is an affront to democracy, and though Holyrood fares far better, AMS is still deeply imperfect. The examples here simply transpose the poll findings onto more proportional voting systems – the reality is that different systems would of course result in different voter behaviour.
For the moment, although the maps are useful for illustrative purposes, I’m opting just to show these hypotheticals as charts. It’s very time consuming making maps, and for these pure hypotheticals, it’s possibly a bit overkill.
If we keep AMS but add some more seats and make it a more proportional version, the SNP still end up pretty heavily over-represented. That would mean combined with a Green bloc, even under this model the current cooperative government would be easily re-elected.
A completely different story if we make it entirely proportional to the list vote. Here the SNP-Green total only comes out at 58 seats, and with a few Alba seats taking it to 62, the pro-Independence side would be clearly behind the pro-Union parties total of 67 seats. That would, it has to be said, accurately represent votes in this scenario.
If you find this or other Ballot Box Scotland output useful and/or interesting, and you can afford to do so, please consider donating to support my work. I love doing this, but it’s a one-man project and takes a lot of time and effort. All donations, no matter how small, are greatly appreciated and extremely helpful.
(About Donations)


