

I’m very excited tonight to be publishing the findings from only the second-ever Ballot Box Scotland commissioned poll. As a reminder for folk unfamiliar with the process, that means I paid a reputable polling for to go away and ask some questions on my behalf. In this case that was Survation (link to tables), who ran the poll from the 21st to the 25th of June. Just as with any other client, I had no role or influence whatsoever in how they conducted the poll beyond supplying the questions. Even then, the questions are not 100% as I drafted them, as pollsters will advise their clients on better framing.
I’m also thrilled to have this poll part-funded by the Herald, who have what is therefore a joint-exclusive with BBS on its findings. As will become apparent when you get to the later parts of this poll, the Herald had no part in this poll beyond that generous funding – all the questions were selected by me and me alone. What that means is that, combined with everyone’s equally generous support for the BBS GE24 crowdfunder, this poll was fully funded by recent donations, leaving around £2,000 in the existing poll fund to roll over for the future.
This is part one of two, though by the time you get to the end of this, you may be wondering what else I could have packed into this bumper poll. Not only does this include the usual Westminster, Holyrood and Independence voting intention, but this piece will look at responses to a range of questions on democratic reform too. You can also read some of my further analysis here in the Herald.
The previous Survation covered the 23rd – 27th of May 2024. Changes are shown as (vs that poll / vs last election).
Votes
As I’ve so often found myself saying lately: hello, margin of error. The changes for the top two parties here are a point up for Labour and down for the SNP, which makes this the widest gap between the two of any recent poll in the BBS tracker. However, because it’s margin of error, I wouldn’t get too carried away here – it confirms that Labour are ahead of the SNP, certainly, but also feeds into the general trend which suggests both parties have plateaued somewhat.
The Conservatives however are down by a much more significant chunk, which likely has something to do with Reform UK’s success. They’ve more than doubled their support since the previous poll (pre the Farage bombshell), enough to squeak ahead of the Lib Dems. This isn’t anywhere close to their UK-level polling, but it is the best they’ve ever polled under their current name, and only a point behind a 9% they had as the Brexit Party back in May 2019. The Greens likewise didn’t feature independently in the last poll, but have a typically modest Westminster share anyway.
Last and definitely least, Alba. I wouldn’t, and pollsters wouldn’t, typically report a party that’s showing up in the tables as 0.4%. However, I did ask them to break Alba out for reasons you’ll see shortly.
Seats
As outlined in a (now very, very, yeesh, look at the lack of quality) old post, I’ve generally avoided providing Westminster projections here on BBS. First Past the Post is really difficult to get right, and even small errors can give huge differences in seats. At Holyrood, that’s moderated by a proportional element that means you can’t be that far off, but pure FPTP at Westminster is a different beast. In addition, plenty of others do those projections much better than I ever could, so why bother?
That said, I have pulled together a simple projection model for this campaign. Unlike Holyrood, I won’t be providing seat-by-seat projections, and I’ll provide the Electoral Calculus estimate on the votes too for comparison, but this just helps provide a little bit more context to the vote figures.
As has consistently proven the case my model is more – pardon me – conservative when it comes to prospective Conservative losses, but also when it comes to Labour gains. Either way, this would give Labour a majority of Scotland’s MPs, around double what the SNP would win. It’s also worth adding that the Conservatives are really not in a good place even on my model, with Douglas Ross for example only about 1% away from losing his seat – or in other words, that’s a statistical tossup that I can’t really be sure about either way.
Votes with Proportional Representation
Fire up your discourse engines, because here’s where things take an interesting turn! In line with Ballot Box Scotland’s long-standing support for Proportional Representation, I decided to also ask how people would vote if Westminster was elected proportionally. As with all such “if a THING happened, how would you vote?” hypotheticals, take this with a barrel of salt, because people are very bad at assessing how they’d react, but I thought it’d be fun to ask anyway.
Even with that in mind, what surprised me about this was how little change there was overall. To emphasise just how small things are, I’ve taken this down to a decimal place – again, I wouldn’t normally do this for polls, but in this context it’s useful. The SNP, Conservatives, Reform UK and Alba all end up with no meaningful difference whatsoever. Which means that the (almost) point the Lib Dems gain and the (almost) three the Greens do, doubling their share, seems to have come entirely from Labour.
For the Lib Dems, that wouldn’t necessarily be surprising, but it might take shock people for the Greens. Whilst I would expect some crossover between Green and Labour support, perhaps not this much. What’s likely to be happening though is a little bit of churn, with complex patterns of flow between parties that cancel one another out. Notably, the tables do suggest that whilst Labour retain the overwhelming majority of those who said they’d vote for them in the main question, at 82.5% it’s the lowest of the four major Westminster parties.
Seats with Proportional Representation
We can translate that into seats through my usual nationally-proportional model, to give us a sense of what that might look like in reality. Turns out that, at least relative to the BBS model, the SNP and Lib Dems have their fair share either way, albeit the distribution for the former would be very different. Labour however, as the big FPTP winners (for the first time in nearly 15 years), would have a much smaller seat haul, though still the largest. With groups of Reform UK and Green MPs, this’d be a much more diverse delegation than we’ll actually see.
Regional Vote
Over on the Scottish Parliament side of things, this is the best poll of the term, and thus since the Independence Referendum, for Labour. Again however, everything here is entirely margin of error, with the tale being the big three parties all make a slight gain, whilst the smaller parties lose out.
That puts the Greens on a joint-worst figure of the term, really emphasising how Survation have since become by far the lowest of the lowball pollsters for the party, and cuts a stark contrast to the 12% Savanta found a few days earlier. This is why averaging is good though, as I think both of these figures are exaggerated – too low from Survation, too high for Savanta, with the truth somewhere in between.
Something to bear in mind here, and this’ll be to the Conservatives’ benefit in particular, is the lack of Reform UK – they didn’t seem to be prompted for in this side of things. Given their strength elsewhere in this poll, I’d be very surprised if they didn’t really have enough support here to win seats.
Constituency Vote
Some bigger shifts over on the constituency vote, which again is a Labour record, aligning entirely with their Westminster share. Survation do have a long history of being particularly Labour-favourable, which I’ve talked about a lot here on BBS, because it was a bit of an outlier in 2021. The counterbalance here is that the SNP remain on their lowest share in my tracker, tied with the previous poll. That means on the face of it, Labour’s gains are coming from a chunky decline for the Conservatives, and margin of error movements from the Lib Dems and Greens.
Seat Projection
Projecting that into seats might give us something like this:
Please see this page for how projections work and important caveats.
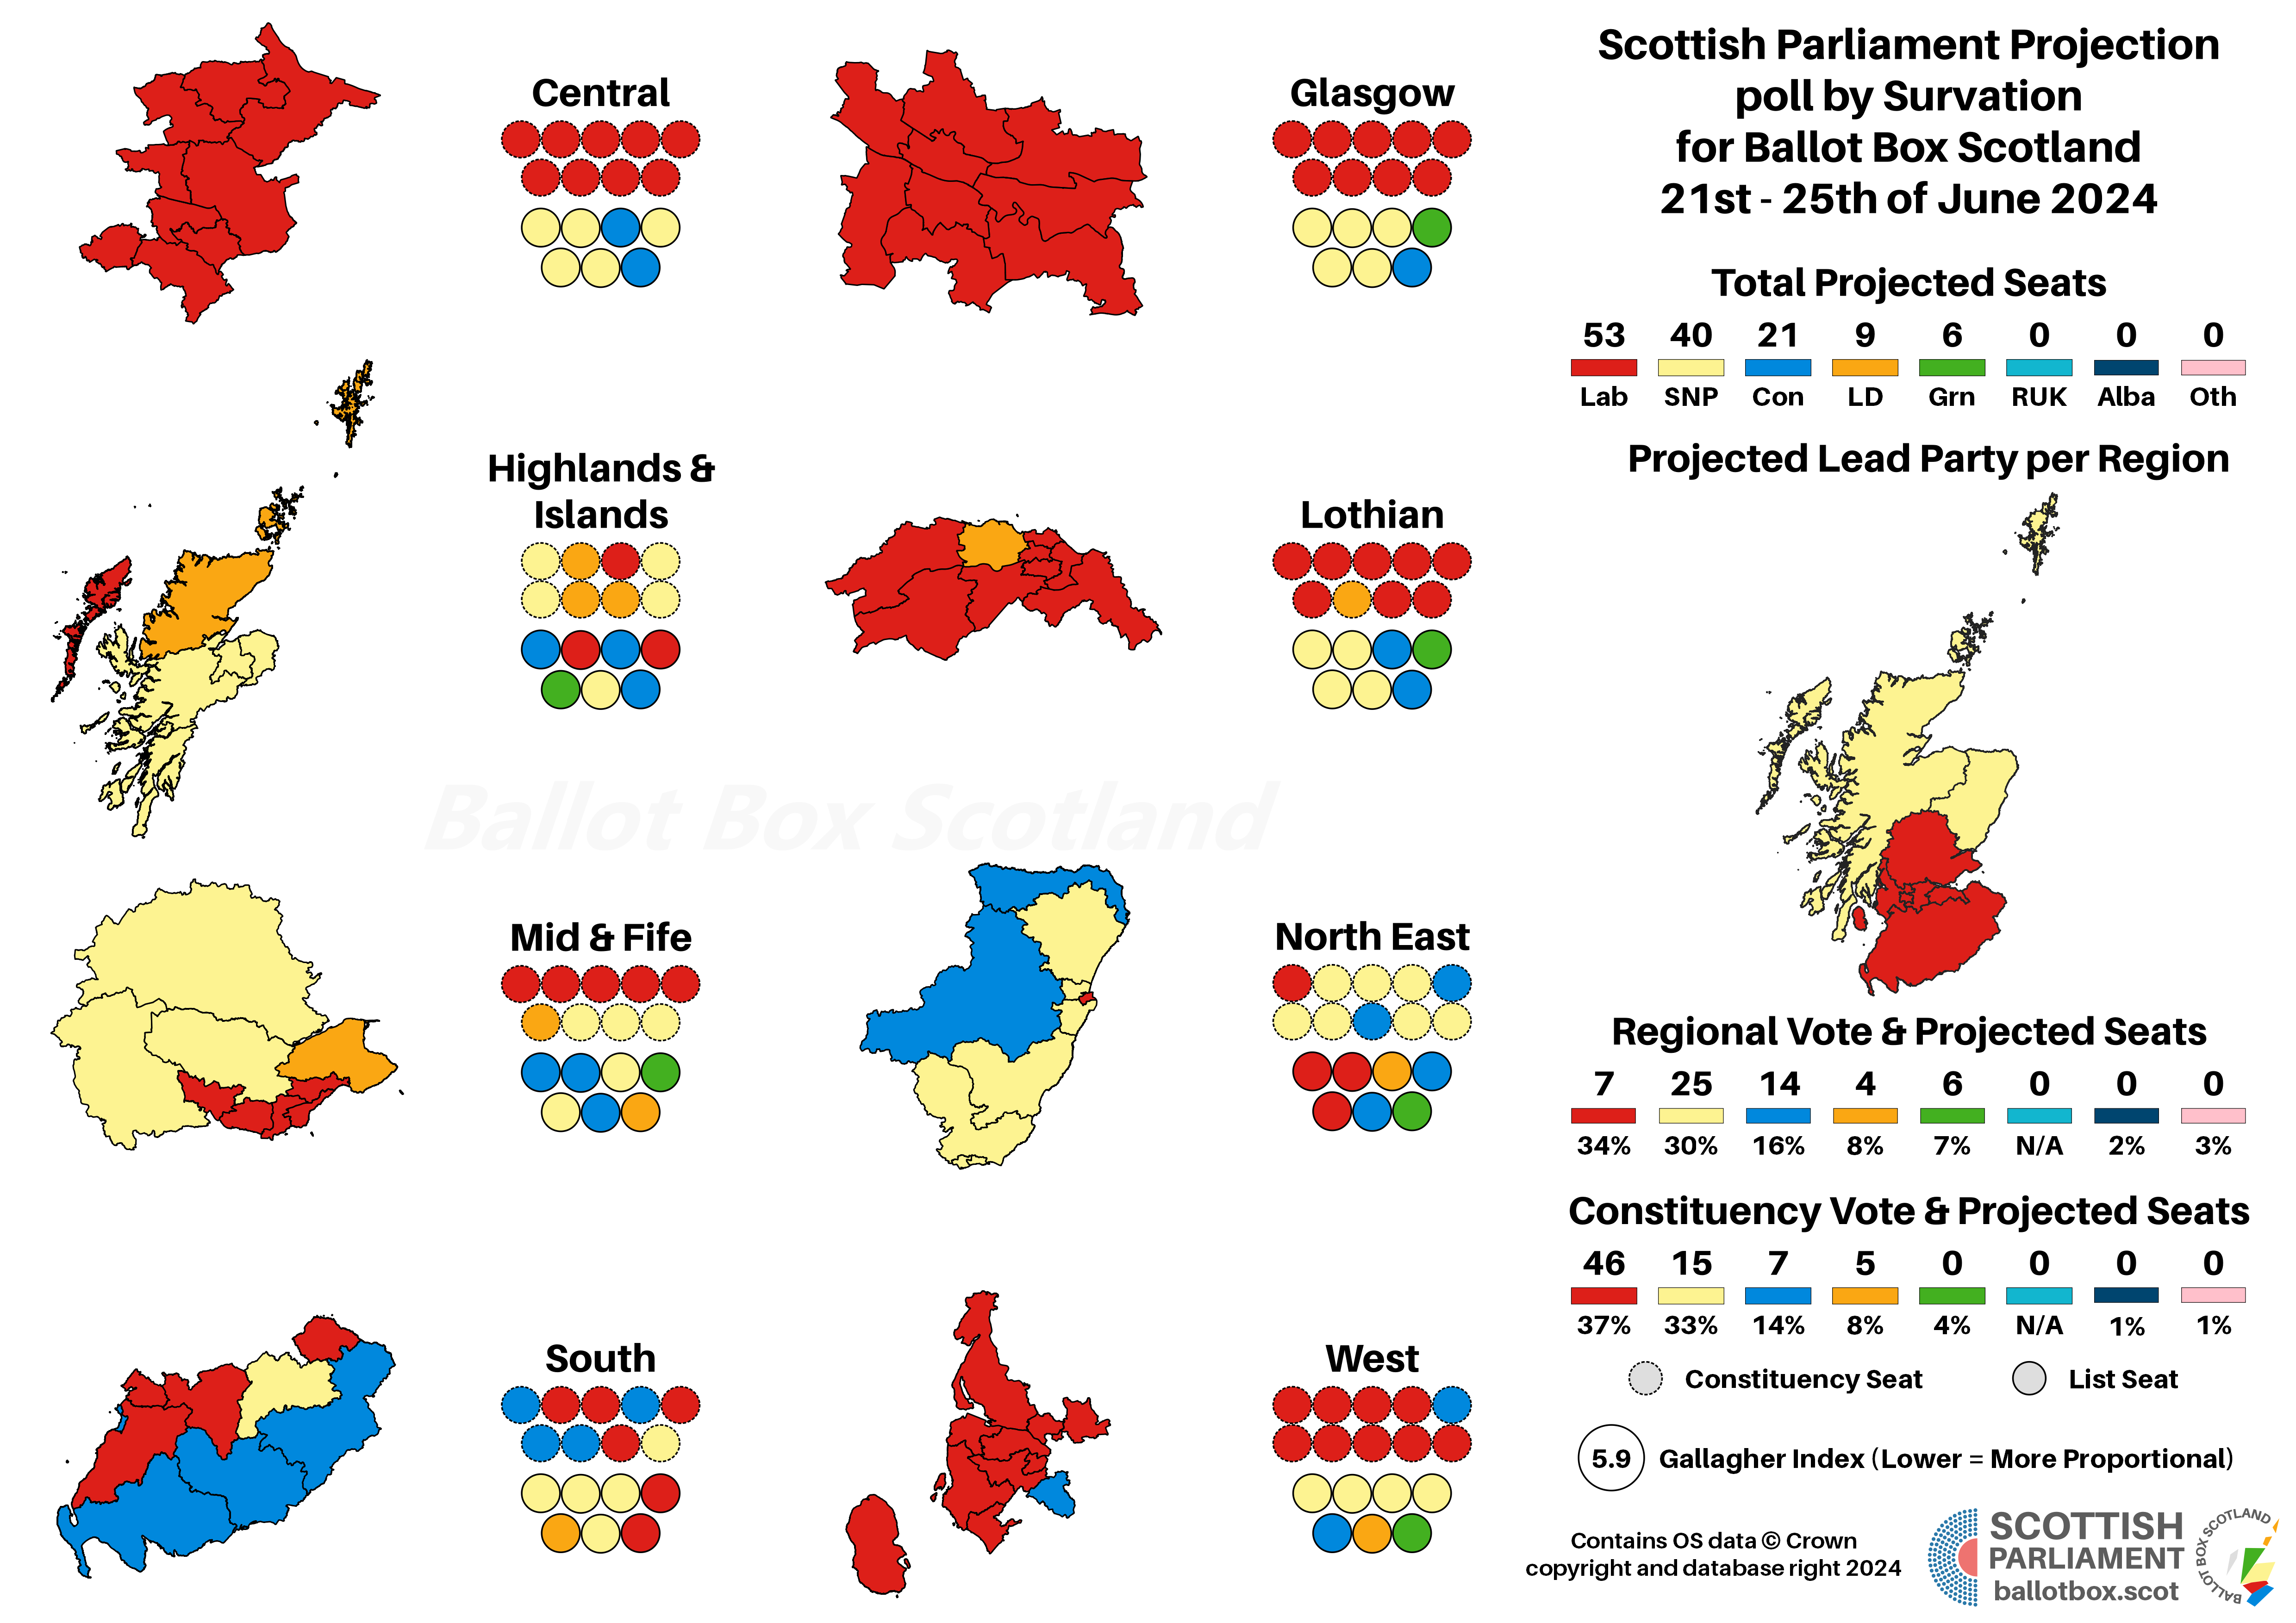
Two things happen here you might expect based on the summaries under the vote shares: firstly, this is Labour’s best poll yet, so it’s their best seat projection as well, this being the first time they’ve broken back into the 50’s, built on some nigh-on-1999 level dominance in the Central Belt. Secondly, it’s the worst for the Greens, though it takes them back to their 2016 level rather than any kind of collapse. They’d even be due a second Lothian MSP but for Labour overhang.
Despite big Labour gains and an expanded Lib Dem contingent relative to 2021, the two still come up short of a majority at 62 seats. That would require them either to get the Greens on board with votes for a traffic light arrangement, or the Conservatives for a united Pro-Union front.
One Proportional Vote
Although Holyrood already has a proportional element, there’s always a lot of chat about how the fact it has two votes might be impacting voters. So, similar to Westminster, we asked how people would vote if it was purely proportional. Again, the figures were very, very similar to what we saw on the list vote, with changes generally being so small I’ve again taken them to a decimal place.
I’d draw initial attention to the Reform UK figure – it’s pretty chunky, and I think confirms what I reckoned about how they probably would have been doing quite well in the main poll had they been prompted for. What might be most interesting here though is what is basically the non-impact of this on the Greens, who drop a statistically meaningless third of a percentage point between the two measures. Although as noted Survation are currently the least Green-favourable pollster in Scotland, that does add to the already substantial evidence base against the notion of Green support being a purely tactical list vote from otherwise SNP supporting voters.
Staying in the Pro-Independence camp, the Alba figure is much more significant relative to their already very low starting point. Almost two-thirds of people who say they’d vote Alba on the List wouldn’t do so if they only had one proportional vote. That might show that Alba are in the exact opposite situation to the Greens: most of their seeming backers are people who would prefer to vote for the SNP, but who are giving their list vote to another party.
Seats with One Proportional Vote
Whereas even on a maximally proportional system the SNP and Greens would have squeaked a bare majority of 66 seats to 63 for the Pro-Union parties (using the AMS List vote), by this point a fully PR model would give them just 48 seats, compared to a whopping 81 for the Pro-Union bloc. I say fully proportional, but as I noted in my analysis for a recent Norstat, there’s a bit of a quirk with Reform UK.
Basically, because they are starting from nearly nothing in 2021, even with the fact my model has merged “All for Unity” an UKIP with them for a single further-right bloc share, my model spreads their vote relatively evenly. That means that even though they tie with the Lib Dems in votes, they pull ahead in seats because they manage despite the proportionality to create an overhang by winning a direct seat in almost every PR constituency. In reality, that kind of even spread would be very unlikely, and we may get a flavour of a more accurate spread next week.
The most boring part of the poll – sorry – is the usual Independence question. Pretty much every poll right now is showing very, very little movement on this front. Survation are on the lower end of the scale for the Pro-Independence side, alongside YouGov, but it remains the case that at the moment Independence is consistently more popular than the parties supporting it, but not more popular than the Union, but also not less popular than 2014. Static in a whole bunch of ways.
Democratic Reform
I don’t exactly keep it a secret on Ballot Box Scotland that I consider much of the UK’s democratic infrastructure to be outrageously, unbelievably antiquated and, frankly, not very democratic at all. I’ve written quite extensively about it, and at the weekend you’ll have seen me Tweet a little bit about the reforms I think are necessary. I’d actually intended to do more work on this side of things, with a refresh of my briefings on each of those topics, but that was a summer job assuming an autumn election, so I didn’t have time.
I did however, of course, slot some questions on this into the poll, which I’ll go through in this section. Spoiler alert: Turns out I’m right and everyone agrees with me, which is very gratifying.
Proportional Representation for Westminster Elections
I’d asked this in the previous BBS-commissioned poll, so changes are versus that poll in March 2022. The full question (duplicating questions asked at UK-level by Make Votes Matter) was: “Proportional Representation is the collective name given to electoral systems which ensure that the proportion of seats a party receives in Parliament closely reflects the proportion of votes they received from voters. To what extent do you support or oppose such a system for elections to the UK Parliament?”
This gave an almost perfect repeat of the previous findings, which show overwhelming support for PR at 55% to a measly 12% opposed. As I was writing this section however, I saw that Keir Starmer had earlier today re-affirmed his commitment to First Past the Post. Of course, because (and this is one of very few areas I do explicit, direct critiques of party policies) he’s about to win big as a result of it, so why would he bother with either what the public actually want or basic democratic principle? Infuriating, but that’s British politics for you.
Proportional Representation for All Elections
Another repeat question reflected on the fact that every election in Scotland uses a different system, asking: “Scotland currently uses three different voting systems for UK Parliament, Scottish Parliament and Local elections. Which of the following statements is closest to your view?” The options for this question were:
- All elections should share the same proportional voting system
- All elections should share the same First Past the Post voting system
- Different elections should use different voting systems
- Don’t Know
Like the previous question, this is pretty similar to when it was last asked. It does have a little bit more meaningful movement, and that is away from all elections using First Past the Post. I do find it interesting how support for using FPTP for everything is higher than explicit support for FPTP at Westminster, which may speak to some of the neutral bloc nonetheless having a very marginal preference for FPTP.
House of Lords Reform
This and the remaining questions were brand new for me in this poll. On Lords Reform, voters were asked: “Members of the House of Lords, who are able to vote on the UK’s laws, hold their seats for life. Which of the following statements is closest to your view?” The options for this question were that the House of Lords should:
- … be replaced with an elected upper house
- … be abolished entirely, with no upper house at all
- … be replaced by an upper house with a mixture of elected and appointed members who serve for a limited period of time
- … be replaced with an appointed upper house, where members serve for a limited period of time
- … not be reformed
Three-quarters of Scots believe the Lords should be reformed in some manner, outnumbering those who don’t support reform at all nearly ten-to-one. There is however a diverse spread of what people would like to see in its place, and you could read this in a range of different ways. A smaller majority of 55% nonetheless support maintaining some form of upper house, whether it’s fully elected, appointed, or a mixture of both.
I didn’t have the space to get into the detail on this, but I’d say it’s a safe assumption that most voters who want reform would accept pretty much any other reform over leaving it unchanged. The Lords is an absolute monstrosity of a body, and whatever good individual peers may do is dwarfed by the grotesque cronyism that is responsible for putting most of their, err, peers (pun not intended) in place.
Of course, this issue isn’t at the top of people’s political agenda, but that’s exactly why it’s a good idea to deal with it as soon as possible. The people most opposed will be those most rooted in the existing institution, and to an incoming Labour government already. Not that Starmer will take my advice, given his stances on FPTP, but that feels like the kind of thing you want to sweep away as early as possible whilst at the peak of your power and authority rather than leave until large amounts of both have ebbed away.
Ballot Access
As discussed in my (in need of refreshing) briefing on ballot access, the UK’s current system of deposits is deeply unfair – so unfair the Electoral Commission itself has recommended it be abolished. On this front, the poll asked: “To stand for election to Parliament in the UK, candidates must pay a £500 deposit. In some other countries, candidates for parties that have already demonstrated support are automatically entitled to stand, whilst other candidates have to collect signatures from voters to demonstrate support. Which of the following statements is closest to your view?” The options for this question were:
- Standing for election should require parties and candidates to demonstrate support from voters
- Standing for election should require candidates to pay a £500 deposit
Again, a clear and stonking majority for the Ballot Box Scotland position. More than twice as many voters think that the decision about who makes it onto ballot papers should be in their hands, rather than come at a financial cost. As I’m always pointing out, for smaller but nonetheless serious parties, the cost of deposits isn’t just £500, it adds up to tens (Scotland-wide) or hundreds (UK-wide) of thousands. Even if you win every deposit back, you can’t spend that money during the campaign.
By contrast, a few handfuls of £500 is nothing for frivolous, joke, or even deliberately misleading parties to stick up a few candidates they have no intention of campaigning seriously for. It’d be far better for our democracy to move towards an entitlements and signatures model, freeing up funds for serious parties to actually try and win votes, whilst acting as a more effective barrier to nonsense candidates.
Party Funding
Finally and similar to the last question, I wanted to ask about the thorny issue of funding for political parties, the subject of my first briefing (again, these need refreshed!). On this front, the poll asked: “Political parties in the UK are currently largely funded by private donations, including from wealthy donors. Some other countries provide public funding for political parties based on how many votes they receive at elections, and limit the value of donations individuals can make. Which of the following statements is closest to your view? ” The options for this question were that political parties should:
- … receive some public funding based on the votes they receive, and large donations should be capped
- … be entirely funded based on the votes they receive
- … be wholly funded by private donations
- … receive some public funding based on the votes they receive, but large donations should not be capped
This completes a hat trick for the Scottish public aligning with Ballot Box Scotland on these technical issues of democratic reform. I have to admit, I’m actually very pleasantly surprised by this side of the poll. The conventional wisdom, and I’d have absolutely shared it until now, would be that voters really dislike political parties and politicians, and so the idea of some of their hard-earned cash going into party coffers would be met with revulsion.
That’s absolutely not the case. A massive 60% of voters are comfortable with the idea of public funding for political parties, and a slim majority of 51% supported one of the options that would limit private donations. The fact nearly one in five voters backed what was implicitly the “ban donations entirely” option was particularly striking. My interpretation of this is that voters may not like parties, but they like the idea of wealthy donors buying influence much, much less. As such, they might be willing to accept a concept like “if I vote for a party, it gets £2 of my tax money for the next few years” as a lesser evil.
Phew! That brings us to an end of the formal analysis for the first part of this poll. The remaining sections are my purely graphical, non-analytical bits about more proportional voting systems. That isn’t the end for this poll however! I’ll be back tomorrow, both here and in the Herald, for some really interesting questions on Scotland’s constitutional status.
Hypotheticals
As ever, the last little bit of analysis concerns those hypothetical and more proportional voting systems that BBS likes to play about with. The use of pure FPTP at Westminster is an affront to democracy, and though Holyrood fares far better, AMS is still deeply imperfect. The examples here simply transpose the poll findings onto more proportional voting systems – the reality is that different systems would of course result in different voter behaviour.
Uniquely, this poll actually *has* notional figures for proportional voting systems. However, rather than disrupt the normal flow of this section, I’ve reported the seat tallies that would arise directly in the earlier text. These all therefore just work on the AMS list vote as per usual.
Scandinavian Style Westminster
If you find this or other Ballot Box Scotland output useful and/or interesting, and you can afford to do so, please consider donating to support my work. I love doing this, but it’s a one-man project and takes a lot of time and effort. All donations, no matter how small, are greatly appreciated and extremely helpful.
(About Donations)


