

Keep tabs on all the latest polling, articles and information ahead of the 2021 Scottish Parliament election in the Ballot Box Scotland Holyrood Hub!
Well, this has been quite a week, hasn’t it? Given the stakes, it wasn’t just been election nerds that were glued to the (at time of writing) inconclusive US Presidential Election. Of course, whilst America’s much vaunted but clearly ailing (and frankly unfit for the 21st century) democratic process creaked ever onwards, the rest of the world didn’t stop.
Here in Scotland, we already had a nice little week lined up with the Kincorth/Nigg/Cove by-election for Aberdeen Council. Remember that’s only the second party-political ballot anywhere in the UK since March, making it more exciting than usual. Then we had the long-awaited release of proposed new boundaries for Argyll & Bute, North Ayrshire and Highland Councils.
As that clearly wasn’t enough work for me, Survation decided to drop a new poll which had run from the 28th of October to the 4th of November. Now that we’re at the 6 month mark, polls are beginning to appear more frequently, which I certainly won’t complain about – but it is knackering on top of everything else this week!
Display format for this post:
- Party/Option – Vote% (Change vs last poll by agency 2nd – 7th of September / vs last election or referendum)
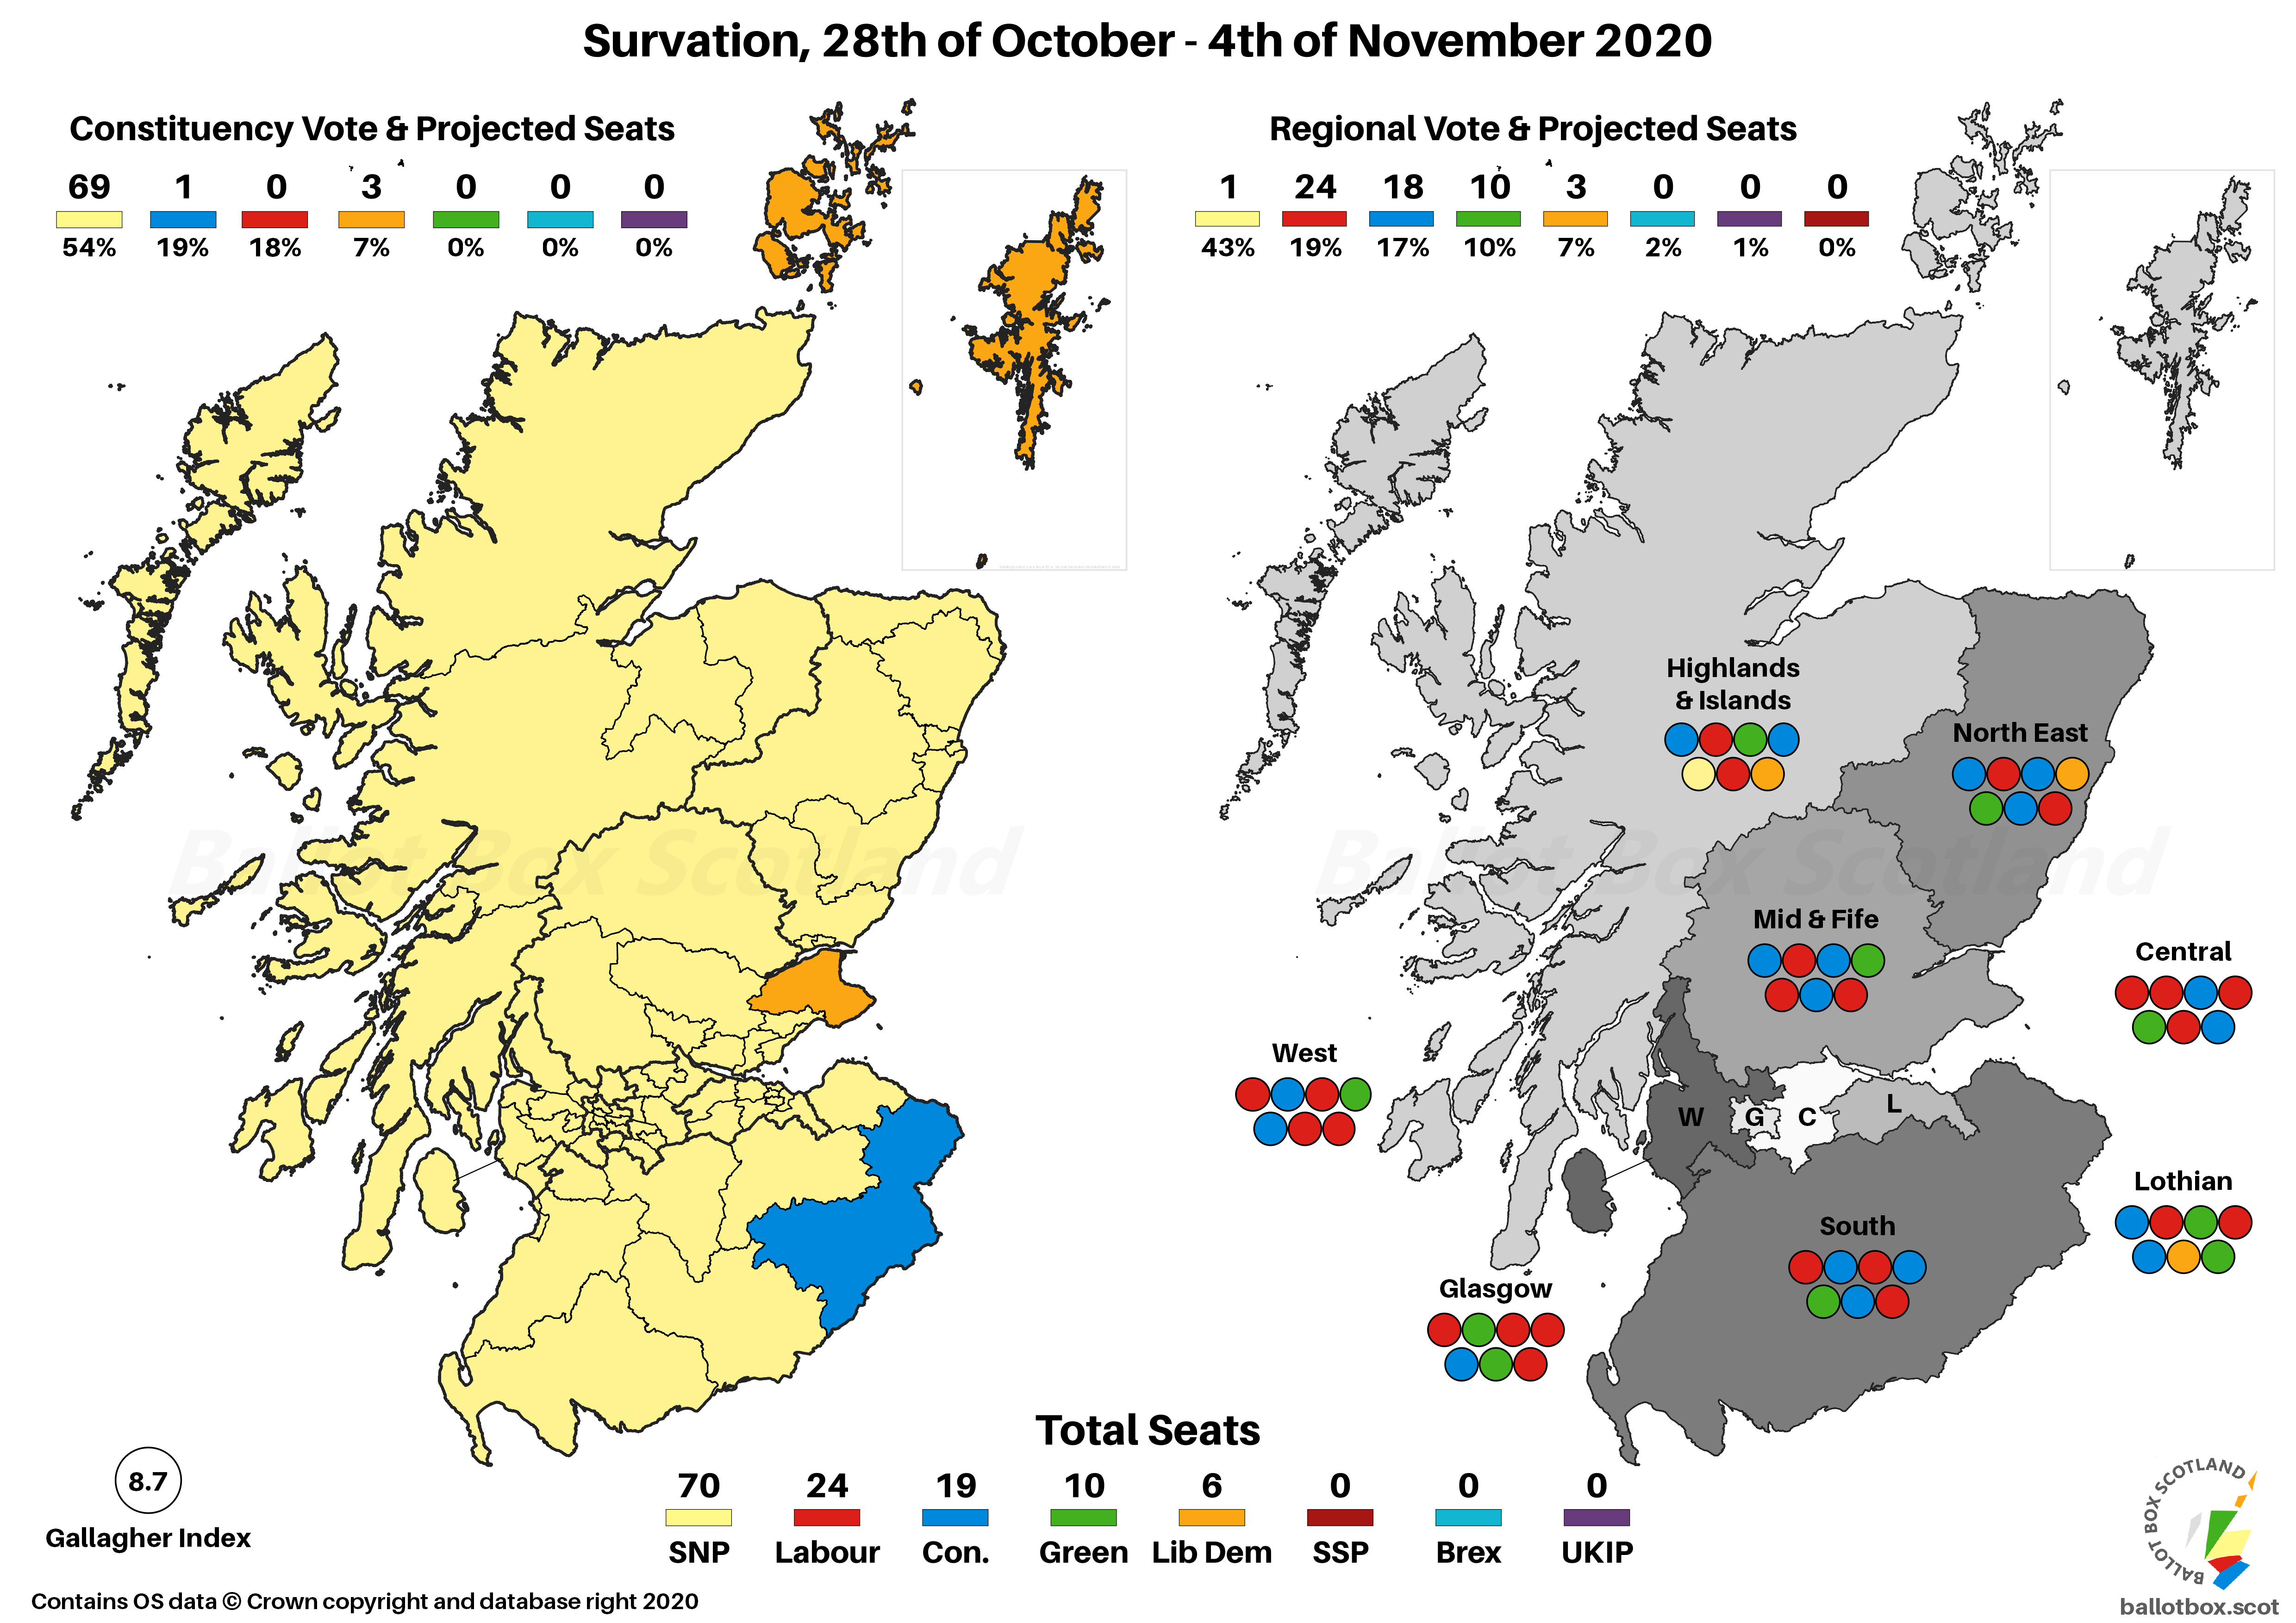
Regional Vote
SNP - 43% (+1 / +1)
Labour - 19% (+1 / nc)
Conservative - 17% (-1 / -6)
Green - 10% (nc / +3)
Liberal Democrat - 7% (-1 / +2)
Brexit - 2% (nc / +2)
UKIP - 1% (-1 / nc)
The thing that most jumps out here is of course Labour overtaking the Conservatives. We haven’t seen a poll for this vote putting Labour back in second since October 2018. As I noted with the tie in the September poll though, literally every poll with a Labour vs Conservative lead or tie since 2016 has come from Survation. Doesn’t mean this is wrong, just bear that trend in mind!
Survation quirk or not, this is the worst Conservative share since that previous election, whereas the SNP are marginally up both versus then and the last poll. The Greens are static, ahead of the Lib Dems who drop back slightly compared to September but are still up overall. After UKIP re-emerged last time, they’ve dropped down in this one.
Constituency Vote
SNP - 54% (+1 / +7)
Conservative - 19% (-1 / -3)
Labour - 18% (nc / -5)
Liberal Democrat - 7% (nc / -1)
There’s a bit less movement on the constituency vote, with just a single point up for the SNP and down for the Conservatives, who come ahead of Labour on this ballot. However, this too is a (joint) worst finding since 2016 for the party.
Survation continue only to ask about the four main parties for the constituency vote, which is fine for projections but annoying for the consistency of my charting!
Seat Projection
Please see this page for how projections work and important caveats.
SNP - 70 (nc / +7)
Labour - 24 (+3 / -3)
Conservative - 19 (-1 / -12)
Green - 10 (nc / +4)
Liberal Democrat - 6 (-2 / +1)

As has been recent trend, the SNP’s massive lead in the constituency vote projects to a majority via those seats alone – indeed, they only pick up one regional list seat. With the Greens also static versus the last poll, the movement is entirely within the pro-Union camp, with Labour establishing a much clearer second place than they had then. It’s always worth the occasional reminder about overhang, which here costs the Lib Dems two seats they’d have won with the SNP less dominant in the constituencies.
SNP - 52% (+1 / +7)
Labour - 20% (-1 / +1)
Conservative- 18% (-2 / -7)
Liberal Democrat- 8% (+2 / -2)
As we approach the anniversary of the General Election, the SNP continue to ride high in polls for this parliament too. As in the other two parts of the poll, they’ve got a little creep upwards too. Amongst the pro-Union parties, the shift is to the Lib Dems’ benefit, whilst Labour and the Conservatives each slide very slightly.
Standard Question
Yes - 47% (+1)
No - 40% (nc)
Don't Know - 13% (nc)
Just a very slight change on the standard Independence question here, effectively a bit of rounding compared to the last poll which puts an additional point in the Yes column without seeming to shift the other two findings.
Excluding Don't Knows
Yes - 54% (+1 / +9)
No - 46% (-1 / -9)
That therefore widens the gap very marginally once Don’t Knows are excluded. I keep repeating the same thing, but this 54% point is roughly where the pro-Independence vote has currently settled. Whether that persists out the other side of the pandemic or the election campaign, no one yet knows.
Council Area Projection
Please see this page for how projections work and important caveats.

On a simple Uniform Swing versus 2014, this might put a total of 21 Councils in the Yes column, an increase on the 4 in 2014. That’d leave 11 for No, down from 28 at the referendum.
Hypotheticals
As ever, the last little bit of analysis concerns those hypothetical and more proportional voting systems that I have a bee in my bonnet about here at BBS. The fact Westminster uses pure FPTP is an affront to democracy, and though Holyrood fares far better, AMS is still deeply imperfect. The examples here simply transpose the poll findings onto more proportional voting systems – the reality is that different systems would of course result in different voter behaviour.
Changes here are vs AMS / vs same projection for the last poll.
SNP - 57 (-13 / +1)
Labour - 25 (+1 / +1)
Conservative - 23 (+4 / -1)
Green - 14 (+4 / nc)
Liberal Democrat - 10 (+4 / -1)

Same story as it always is with this more proportional system, with the SNP coming off far less well, though still with a very commanding lead. There’s a lovely little pattern of 4 seater gains versus AMS for the Conservatives, Greens and Lib Dems, with Labour having the most modest gain – they are actually almost spot on even under AMS.

Scandinavian Style Westminster
We’re now beginning to get repeat Westminster polling, so changes here are versus the same projection on the last poll. (Remember, I don’t do Westminster projections given they are purely FPTP, amongst other reasons.)
SNP - 31 (+1)
Labour - 12 (-1)
Conservative - 11 (-1)
Liberal Democrat - 5 (+1)

Given the clear SNP majority in the vote, they naturally come out with a majority of seats in this model. Whereas we’d expect most of the non-SNP constituencies to turn yellow in First Past the Post, this would ensure proper representation for those voting for other parties. Bear in mind too that voter behaviour would be very different with PR.
If you find this or other Ballot Box Scotland output useful and/or interesting, and you can afford to do so, please consider donating to support my work. I love doing this, but it’s a one-man project and takes a lot of time and effort. All donations, no matter how small, are greatly appreciated and extremely helpful.
(About Donations)


