Keep tabs on all the latest polling, articles and information ahead of the 2021 Scottish Parliament election in the Ballot Box Scotland Holyrood Hub!
Not to be outdone by Panelbase’s trio of April polls, ComRes’ partnership with the Scotsman has also turned up a third poll from them this month. This follows just a week after their previous poll, and just one week until election day itself. There can’t be many more of these analysis pieces for me to do now!
Display format for this post:
- Party/Option – Vote% (Change vs last poll by agency 16th – 20th of April / vs last election or referendum)
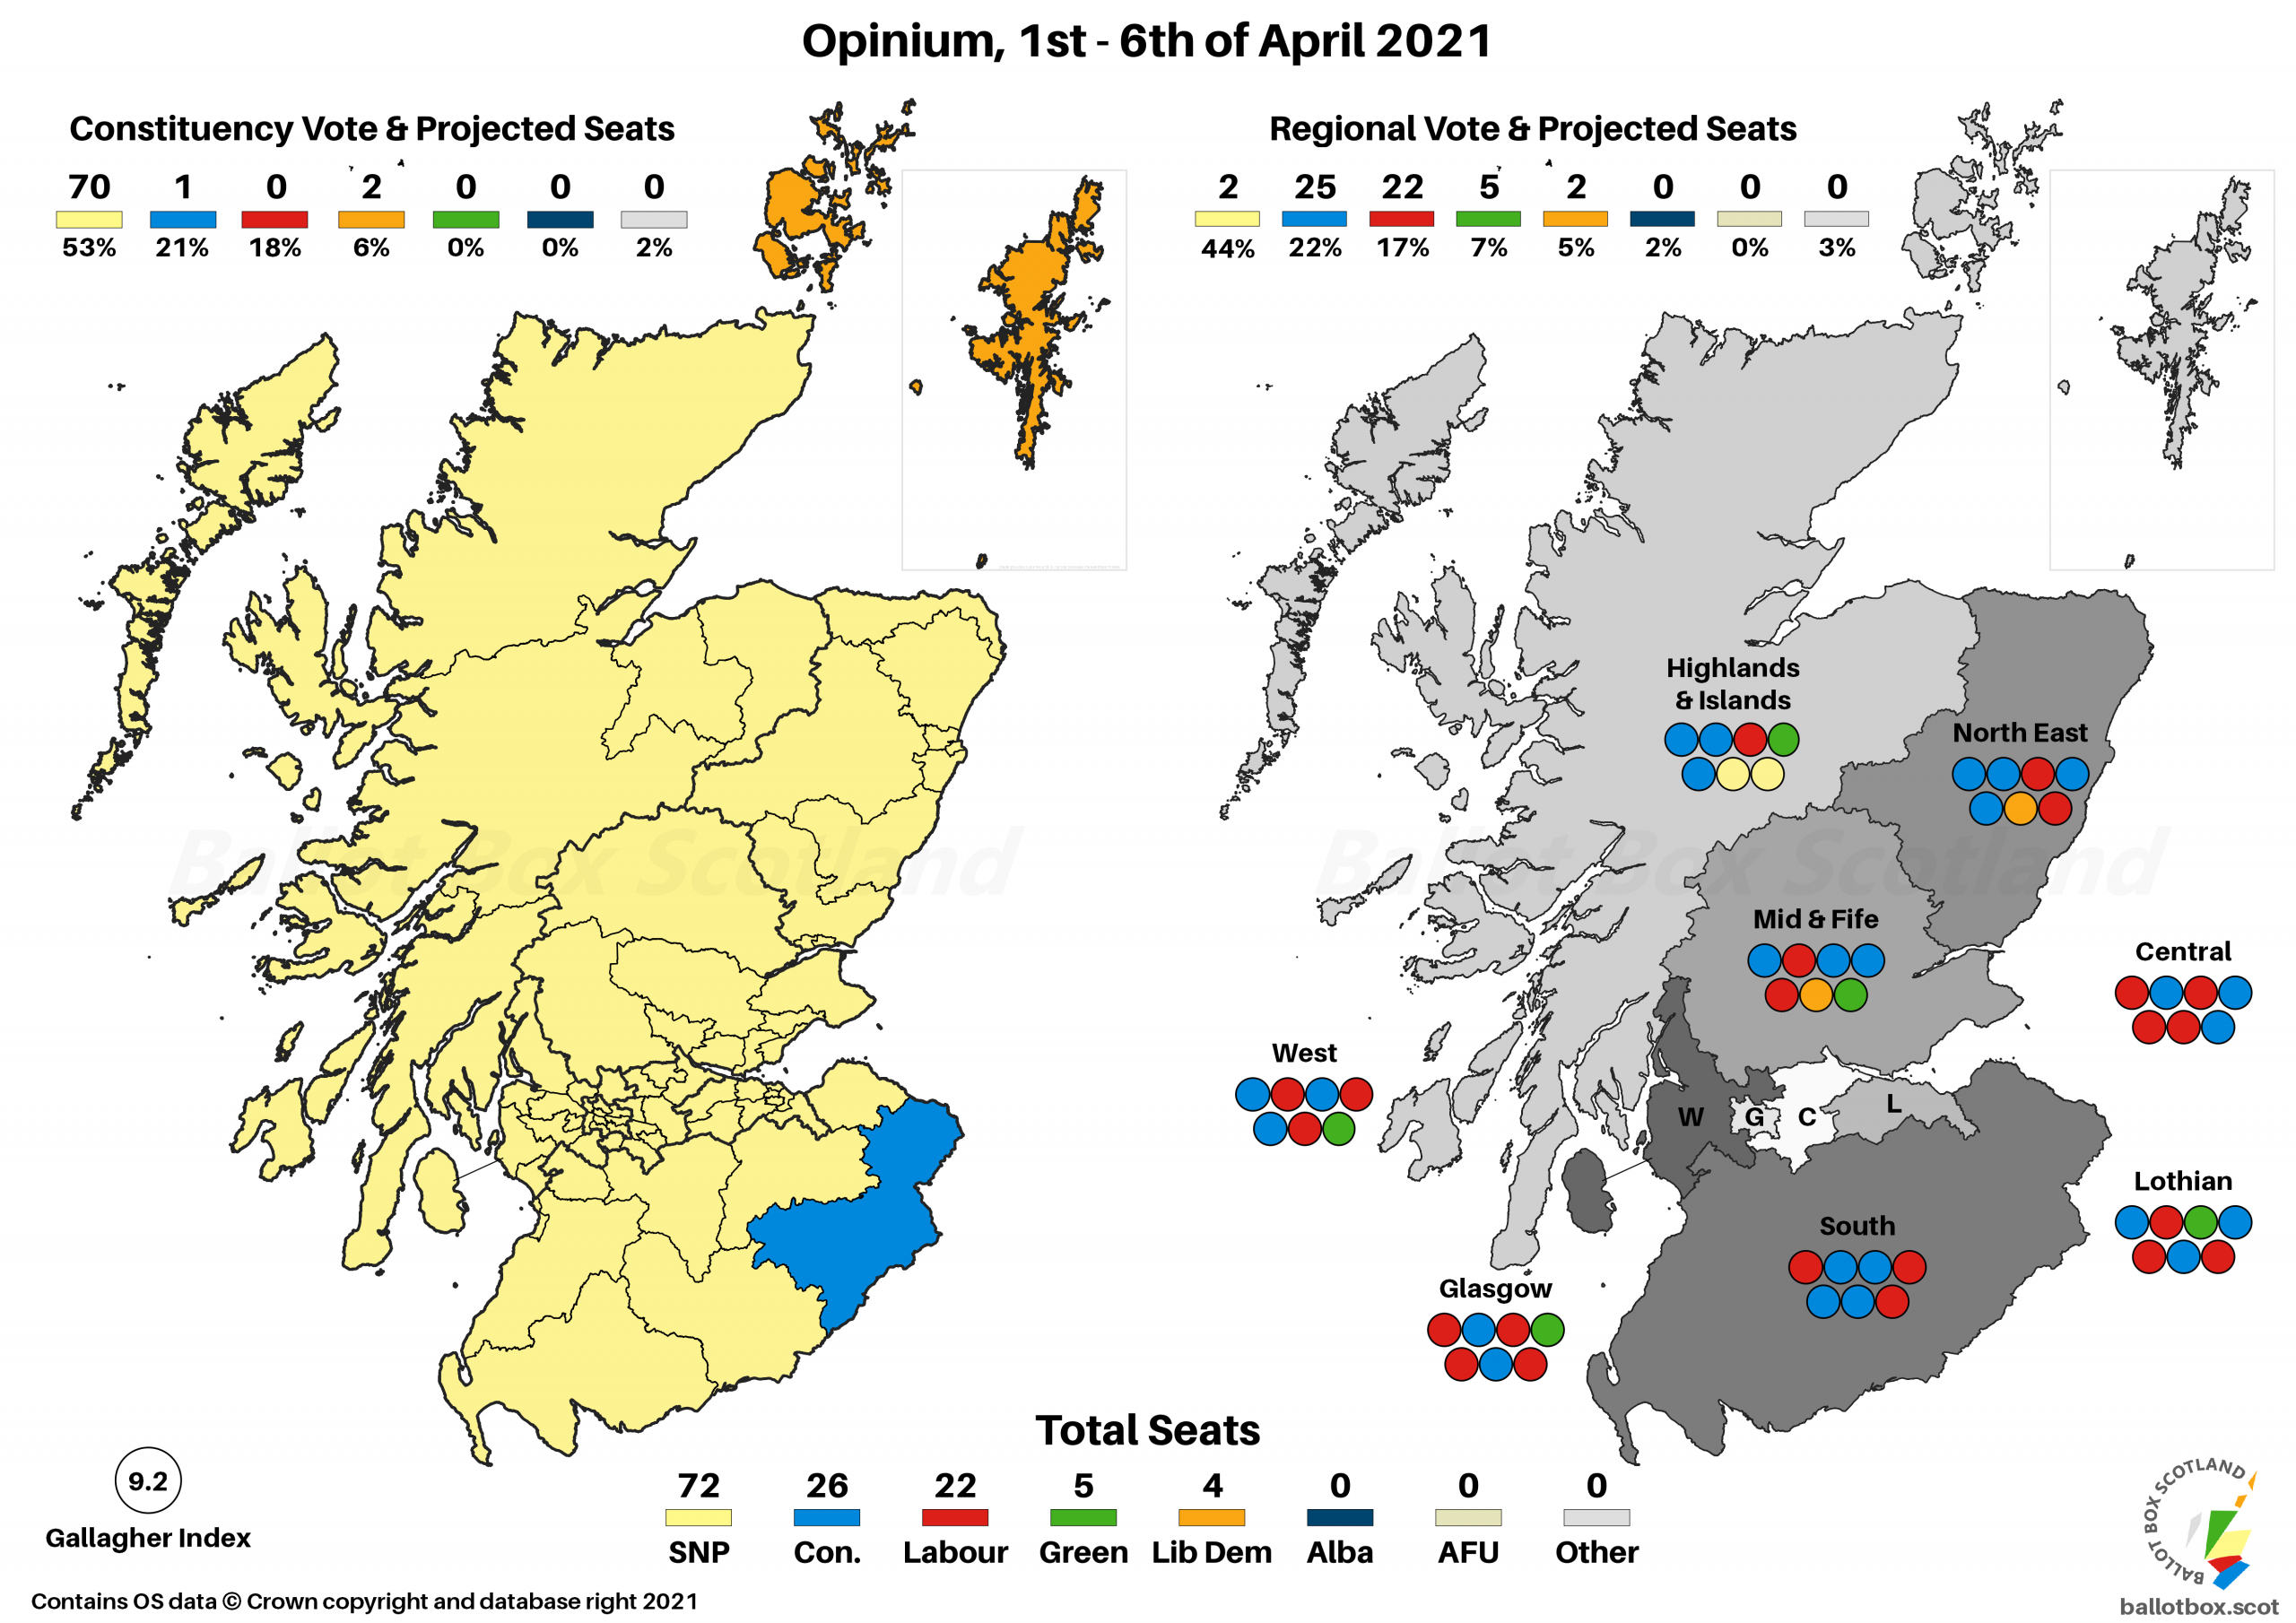
Regional Vote
SNP ~ 36% (-2 / -6)
Conservative ~ 22% (-1 / -1)
Labour ~ 19% (+2 / nc)
Green ~ 10% (+3 / +3)
Liberal Democrat ~ 5% (nc / nc)
Alba ~ 2% (+1 / +2)
Although everyone bar the Lib Dems have some movement here, especially given the timescales involved there’s likely to be a large degree of just bouncing around margins of error. Slight decreases for the SNP and Conservatives are counterbalanced by gains for Labour and Alba, who though still on a very low share recover from their worst polling yet in the last poll. The largest gain here goes to the Greens, up 3% versus what had been a ComRes record low in the last poll, which could have been a bit of an outlier then.
Constituency Vote
SNP ~ 45% (-1 / -2)
Conservative ~ 23% (-2 / +1)
Labour ~ 23% (+3 / nc)
Liberal Democrat ~ 7% (+1 / -1)
Over on this vote we again see dips for the SNP and Conservatives, whilst it’s Labour and the Lib Dems gaining as a result. Though Labour will be glad to see another poll putting them on level pegging with the Conservatives, it remains the case that this is the vote that’s least useful in, at least in terms of delivering the maximum number of Labour MSPs.
Seat Projection
Please see this page for how projections work and important caveats.
Projecting that into seats might give us something like this:
SNP ~ 61 (-1 / -2)
Conservative ~ 28 (-4 / -3)
Labour ~ 24 (+1 / nc)
Green ~ 11 (+4 / +5)
Liberal Democrat ~ 5 (nc / nc)


With constituency figures not very far off what they were in 2016, this projects to a slightly smaller SNP group than at that election given the deflated list vote. They are still miles ahead of anyone else however, and Green growth would keep a comfortable pro-Independence majority overall. Given we’ve also recently had a couple of polls projecting to an SNP majority, it’s worth remembering how fine the line is between majority and minority thanks to AMS.
No Westminster Q in this one.
Standard Question
No ~ 49% (+1)
Yes ~ 42% (-2)
Don't Know ~ 8% (nc)
ComRes continue to find a widening of the constitutional gap in the Union’s favour, this being the most support for No in a poll since December 2019.
Excluding Don't Knows
No ~ 54% (+2 / -1)
Yes ~ 46% (-2 / +1)
Take those Don’t Knows out and we’re almost back to the 2014 status quo, again giving a much wider lead for the Union than has been seen at any other point for the past 18 months or so. The current multi-pollster average now has this as a dead heat on 50:50, as we continue to see movement favourable to the Union in polling.
Council Area Projection
Please see this page for how projections work and important caveats.

On a simple Uniform Swing versus 2014, a total of 26 council areas might be leaning No, down only slightly from 28. Meanwhile, 6 would lean Yes, up marginally from 4 in 2014.
Hypotheticals
As ever, the last little bit of analysis concerns those hypothetical and more proportional voting systems that I have a bee in my bonnet about here at BBS. The fact Westminster uses pure FPTP is an affront to democracy, and though Holyrood fares far better, AMS is still deeply imperfect. The examples here simply transpose the poll findings onto more proportional voting systems – the reality is that different systems would of course result in different voter behaviour.
As the election approaches and polls are coming out more frequently, I’m jettisoning the actual map for this one for now. I still think it’s a fun and useful exercise, but it’s also time consuming to manually change 129 bubbles! (The AMS projection is only 56 bubbles, because the 73 constituencies are driven from a spreadsheet).
Changes here are vs AMS / vs same projection for the last poll.
SNP ~ 50 (-11 / -4)
Conservative ~ 31 (+3 / -2)
Labour ~ 27 (+3 / +2)
Green ~ 14 (+3 / +4)
Liberal Democrat ~ 7 (+2 / nc)
Usual dynamic here which is a smaller SNP group not over-inflated by FPTP, whilst everyone else is better of. As with some other recent polls though there’s a roughly even split between the two constitutional blocs in this hypothetical, the balance would slenderly towards Union, with 65 seats versus the 64 for the two pro-Independence parties.

If you find this or other Ballot Box Scotland output useful and/or interesting, and you can afford to do so, please consider donating to support my work. I love doing this, but it’s a one-man project and takes a lot of time and effort. All donations, no matter how small, are greatly appreciated and extremely helpful.
(About Donations)