

Keep tabs on all the latest polling, articles and information ahead of the 2021 Scottish Parliament election in the Ballot Box Scotland Holyrood Hub!
Last night I raced through analysis for three different polls, and tonight I’m doing exactly the same. I’m taking these by the very scientifically defined order of “earliest fieldwork first, then alphabetically”, so we begin with this one from Ipsos MORI, then we’ll have ComRes and finish with Survation. These are the last polls of the campaign, much to my relief!
Display format for this post:
- Party/Option – Vote% (Change vs last poll by agency 29th of March – 4th of April / vs last election or referendum)
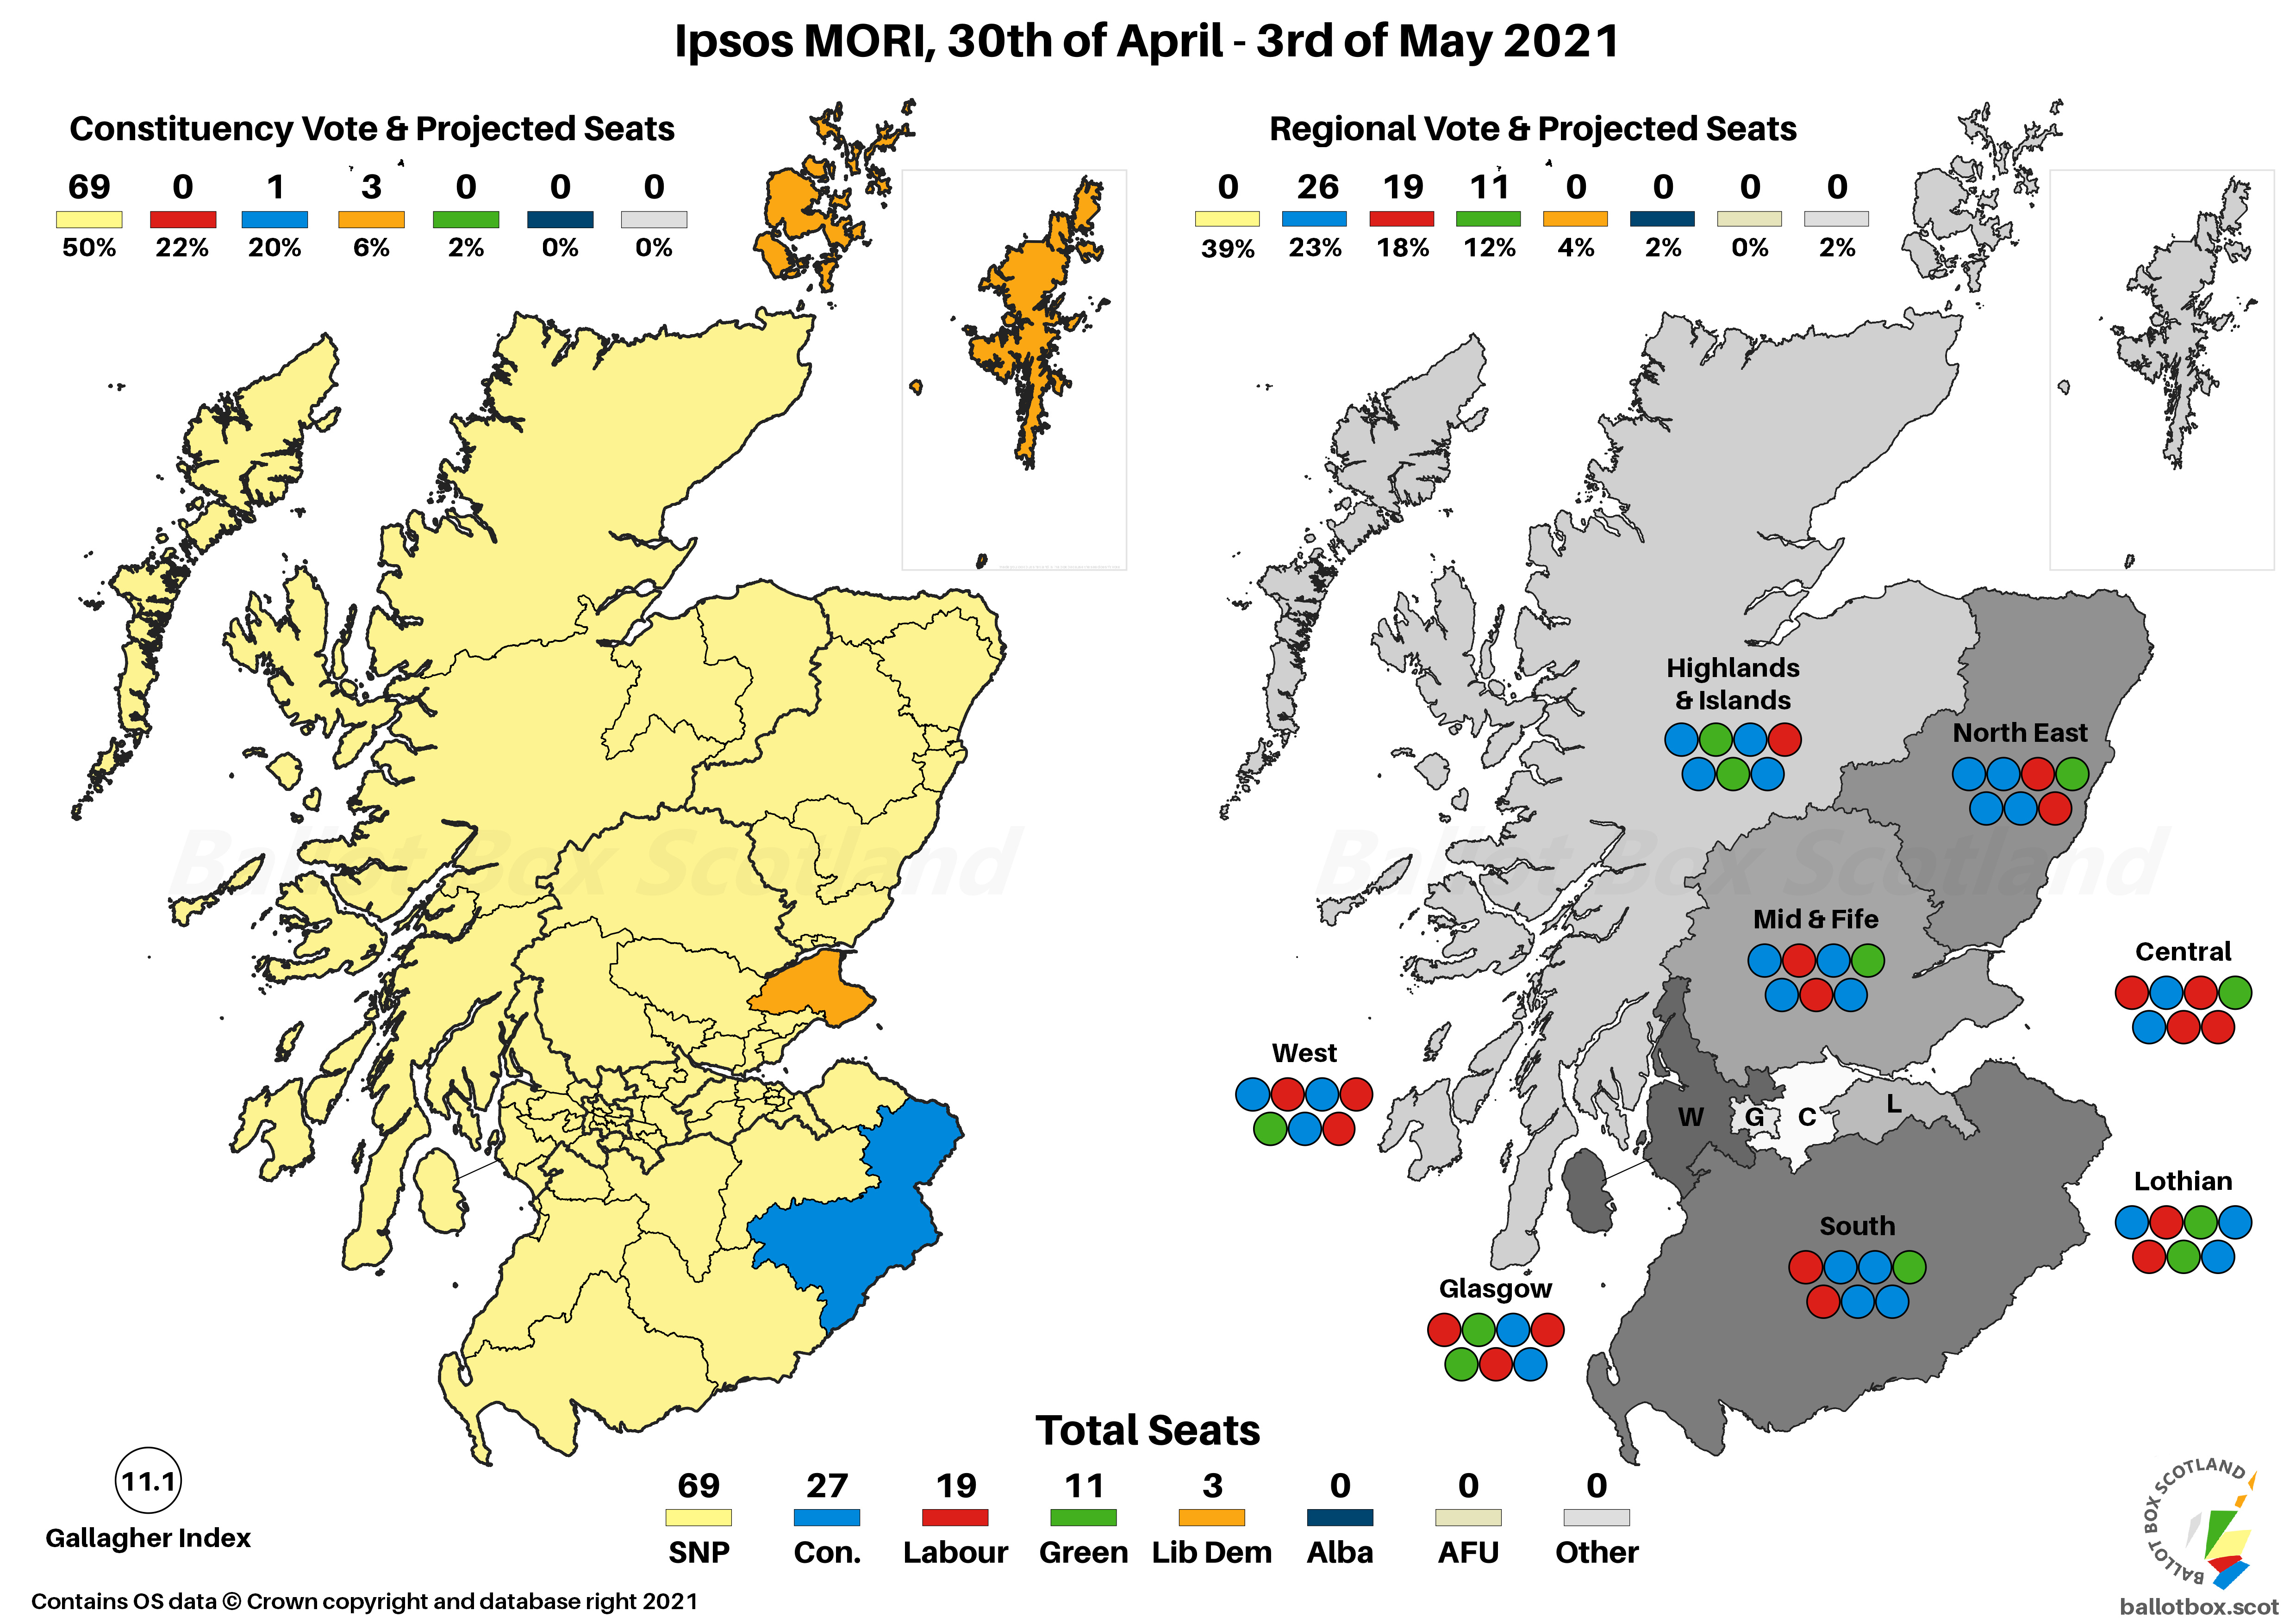
Regional Vote
SNP ~ 39% (+1 / -3)
Conservative ~ 23% (+2 / nc)
Labour ~ 18% (nc / -1)
Green ~ 12% (nc / +5)
Liberal Democrat ~ 4% (-2 / -1)
Alba ~ 2% (-1 / +2)
It’s steady in the middle and movement at the top and bottom in this poll. Amongst pro-Independence parties, the SNP are up very slightly on the previous poll, whilst Alba are down by the same amount, and the Greens remain on one of their highest shares of any pollster – trumped only by that 13% YouGov had yesterday.
For the pro-Union camp it’s Labour holding steady on the last poll but just short of their 2016 figure. The Conservatives match their last election figure by gaining 2% on the last poll, but a drop of 2% for the Lib Dems gives them their worst figure of the entire term for this vote.
Constituency Vote
SNP ~ 50% (-3 / +3)
Labour ~ 22% (+4 / -1)
Conservative ~ 20% (nc / -2)
Liberal Democrat ~ 6% (nc / -2)
Green ~ 2% (nc / +1)
Though the SNP are notably down on the last poll, they still manage to pull half of the total number of constituency votes. The only other change is a quite mighty 4% gain for Labour, but again this is on completely the wrong vote for them to maximise their number of seats, though such a result on the day could preserve at least one of their constituencies depending on where it was.
Seat Projection
Please see this page for how projections work and important caveats.
Projecting that into seats might give us something like this:
SNP ~ 69 (-2 / +6)
Conservative ~ 27 (+3 / -4)
Labour ~ 19 (nc / -5)
Green ~ 11 (nc / +5)
Liberal Democrat ~ 3 (-1 / -2)
In seat terms Ipsos join with most other pollsters in envisioning an SNP majority, though a bad day in a small number of key constituencies could change that. Having dropped a big chunk of their vote, the Lib Dems also project to a record low of just 3 seats at Holyrood. For the 3% polls this is where the “they could get Salmond in” caveat has gone, but on 2% it’s vanishingly unlikely we’d see any Alba MSPs.
No Westminster Q in this one.
Standard Question
Yes ~ 47% (-2)
No ~ 47% (+2)
Don't Know ~ 6% (nc)
At this point, regular readers should be able to reel off, word-for-word, what my analysis of this is. It’s on a knife-edge, totally margin of error, who knows which way Scotland would go in an actual referendum right now? We can score another one for the exact tie stakes, giving us a handful of ties across our final polls of the Holyrood campaign.
Excluding Don't Knows
Yes ~ 50% (-2 / +5)
No ~ 50% (+2 / -5)
Ties all the way down, of course. It’s particularly interesting to have this coming from Ipsos MORI, given they’ve tended to find the most Independence-favourable figures recently.
Council Area Projection
Please see this page for how projections work and important caveats.

On a simple Uniform Swing versus 2014, 17 councils might favour No, down from 28 last time, and 15 might lean towards Yes, up from 4.
Hypotheticals
As ever, the last little bit of analysis concerns those hypothetical and more proportional voting systems that I have a bee in my bonnet about here at BBS. The fact Westminster uses pure FPTP is an affront to democracy, and though Holyrood fares far better, AMS is still deeply imperfect. The examples here simply transpose the poll findings onto more proportional voting systems – the reality is that different systems would of course result in different voter behaviour.
As the election approaches and polls are coming out more frequently, I’m jettisoning the actual map for this one for now. I still think it’s a fun and useful exercise, but it’s also time consuming to manually change 129 bubbles! (The AMS projection is only 56 bubbles, because the 73 constituencies are driven from a spreadsheet).
Changes here are vs AMS / vs same projection for the last poll.
SNP ~ 52 (-17 / +2)
Conservative ~ 31 (+2 / +4)
Labour ~ 24 (+5 / nc)
Green ~ 16 (+5 / nc)
Liberal Democrat ~ 6 (+3 / -2)
Alba ~ 0 (nc / -4)
Take away the SNP’s first past the post edge and everyone else does better, as I’m sure everyone knows by now. Though Alba drop out this time for lack of enough votes to cross the threshold, a large Green contingent would tip the constitutional balance of the chamber towards Independence, with a 68:61 split overall.

If you find this or other Ballot Box Scotland output useful and/or interesting, and you can afford to do so, please consider donating to support my work. I love doing this, but it’s a one-man project and takes a lot of time and effort. All donations, no matter how small, are greatly appreciated and extremely helpful.
(About Donations)


